Overview - The Problem
After many years and many acquisitions (AboveNet, GSI, Layered Tech, Nuvem, GoGrid, Dual Spark, Adapt..etc)Datapipe's ability to track customer resources had become severely handicapped by the many separate and disconnected systems and processes which held some part of those records. There was no single source of truth for the customers footprint within Datapipe. This became a problem for all sorts of reasons; contract renewal, billing, reporting and auditing so, we set about creating a data warehouse application to facilitate asset discovery. Internally, the project was labeled "Alexandria" after the great Egyptian library. The fate of this library was not lost on me so, it held some fatalistic connotations I didn't like - but I got over it.
- The Gist
- The Landscape
- The Brief
- The Goal
- The Team
- My Part
- The Requirements
- Approach & Research
- The Design Process
- Lessons Learned
- Conclusion
The Gist
If you don't have time to read through the process, the thumbnails below ought to give you an idea of it from 1000ft.
The gist of the Data Warehouse Project aka "Alexandria"
The Landscape
Each customer record featured in part across 10 - 20 individual systems including individual office applications such as Microsoft Outlook, Excel and One Note. When a customer wanted their invoice explained to them a member of the inside sales or service delivery team had to collaborate with billing, finance, legal, software development, support ...etc to name but a few in order to collate a record of all that customer's resources and managed services. The time taken for one such audit was considerable - often a few days per customer. It simply wasn't sustainable.The Brief
Design a UI which amalgamated data from numerous API's so as to enable data discovery by internal employees.The Goal
Tap into the many disparate systems and services which together constituted each customers managed service record across the organization and present the data in an intuitive form to those who needed to 'discover' it and make sense of it for invoice inquiry, audits, contract renewal and overall reconciliation.The Team
Developers, QA, Stakeholders, Execs, Project Managers, Testers and myself.My Part
Work with internal employees and developers to research and develop a design which could accommodate all the data returned by API queries and render it intuitively for internal analysis.The Requirements
Interview internal employees - learn about their job, how they describe it, how they actually practice it, what the current pain points are that this tool might address, who are their customers both internally and externally and what are their typical needs/expectations. From an esoteric perspective, corral the language used to describe the current scrambled process across multiple employee disciplines and create consensus. Create a UI which could be explained to say an Intern so that they might assist in reconciling resources and determine the overall financial status of the customers record within Datapipe. It should support data export to CSV and be responsive.Approach & Research
Equipped with basic requirements, let's dig deeper. Who is involved in this need? Who does it serve, who is requesting a solution to the problem? Who do we need to speak with, how do they perform their roles today, can we summarize these demographics and what if any are the hidden pitfalls in this undertaking?
The Players
Who are they? Datapipe is very customer focused. It has to be as a managed services company as it is literally managing IT complexity for paying customers. As you might expect, this meant just about every department in the company was responsible for some part of the customers paying subscription. So Finance, Sales, Legal, Software, Support,....etc. You name it, they have something to do with tracking some part of the customers account. So I set about speaking with each of them.
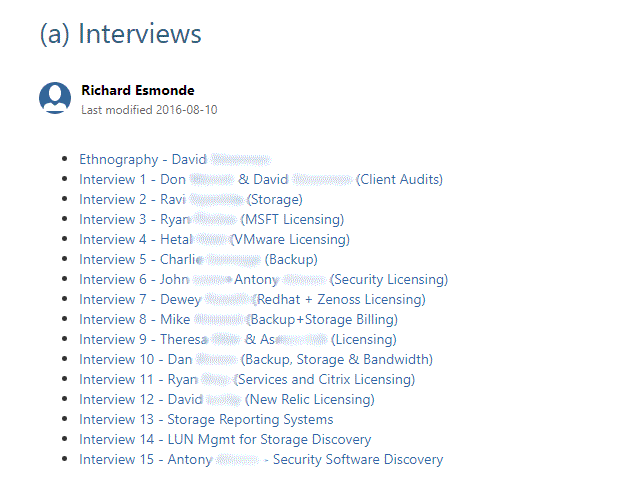
The Interviews
Most of Datapipe is located on the east coast so I flew out there to meet the team I'd work with and the folks we'd build a solution for. Preliminary conversations happened face to face in New Jersey and over teleconference and phone with employees in other Datapipe locations(Austin, Somerset, Kansas,...etc). I returned to my office in San Francisco. Follow-up discussions transpired over various media (GoToMeeting, HighFive, Phone, Email and Slack). Everything was documented and stored on a collaborative wiki (Atlassian's Confluence).
The Workflows
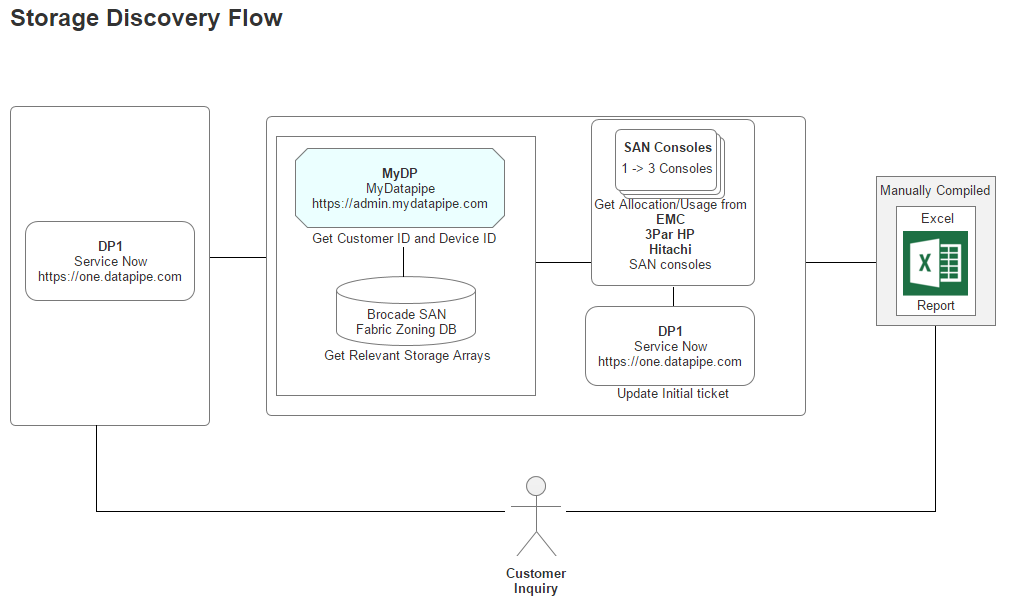
During interviews, I was especially interested to learn who the Datapipe employee served, what requests were being made of them by these people and what systems they had to touch in order to build a report to hand-off to whom (usually, internal Sales, Support, Service Delivery personnel). This helped us understand what API's we had to poll data from and who else we might need to speak with. So, workflows were rapidly distilled down to simple block diagrams which called out systems and requestors.
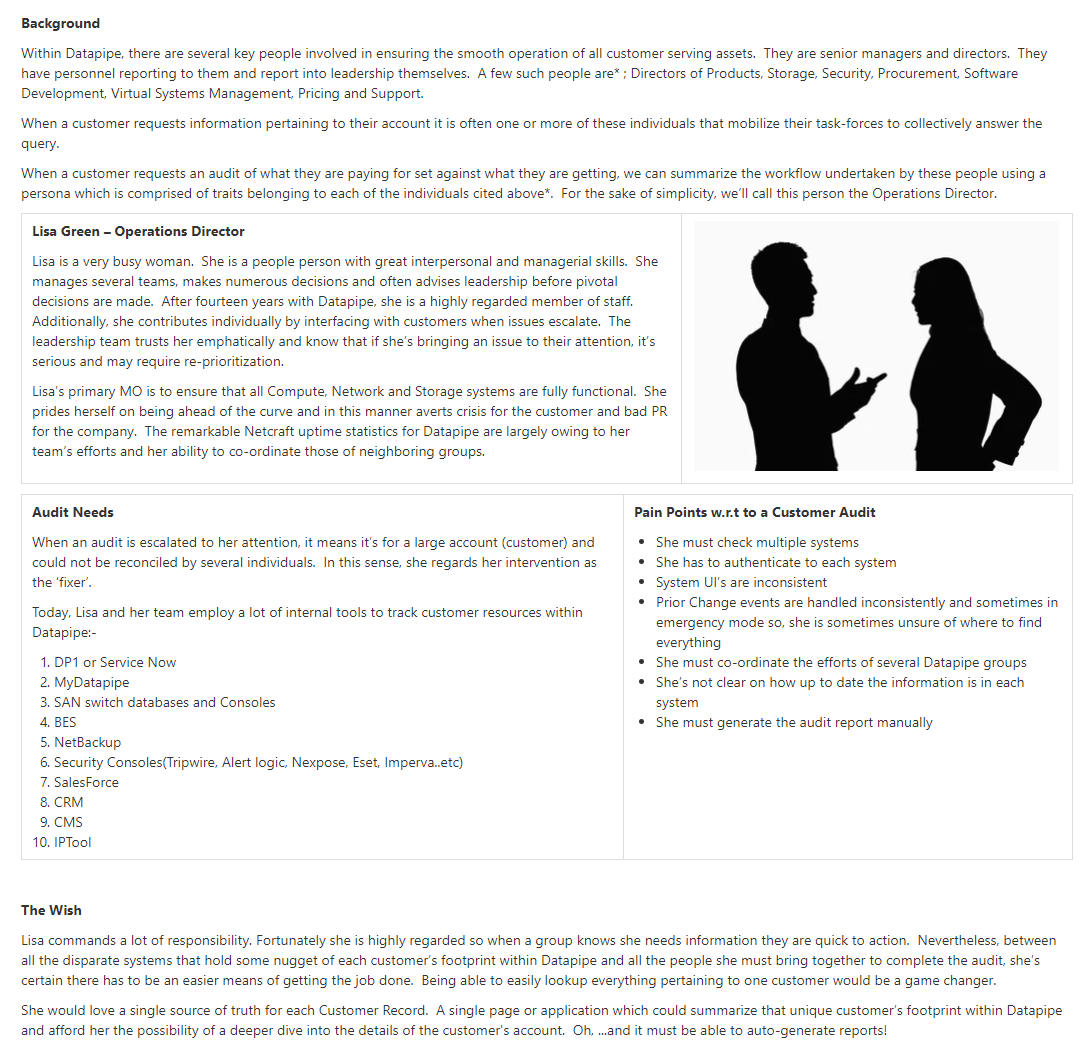
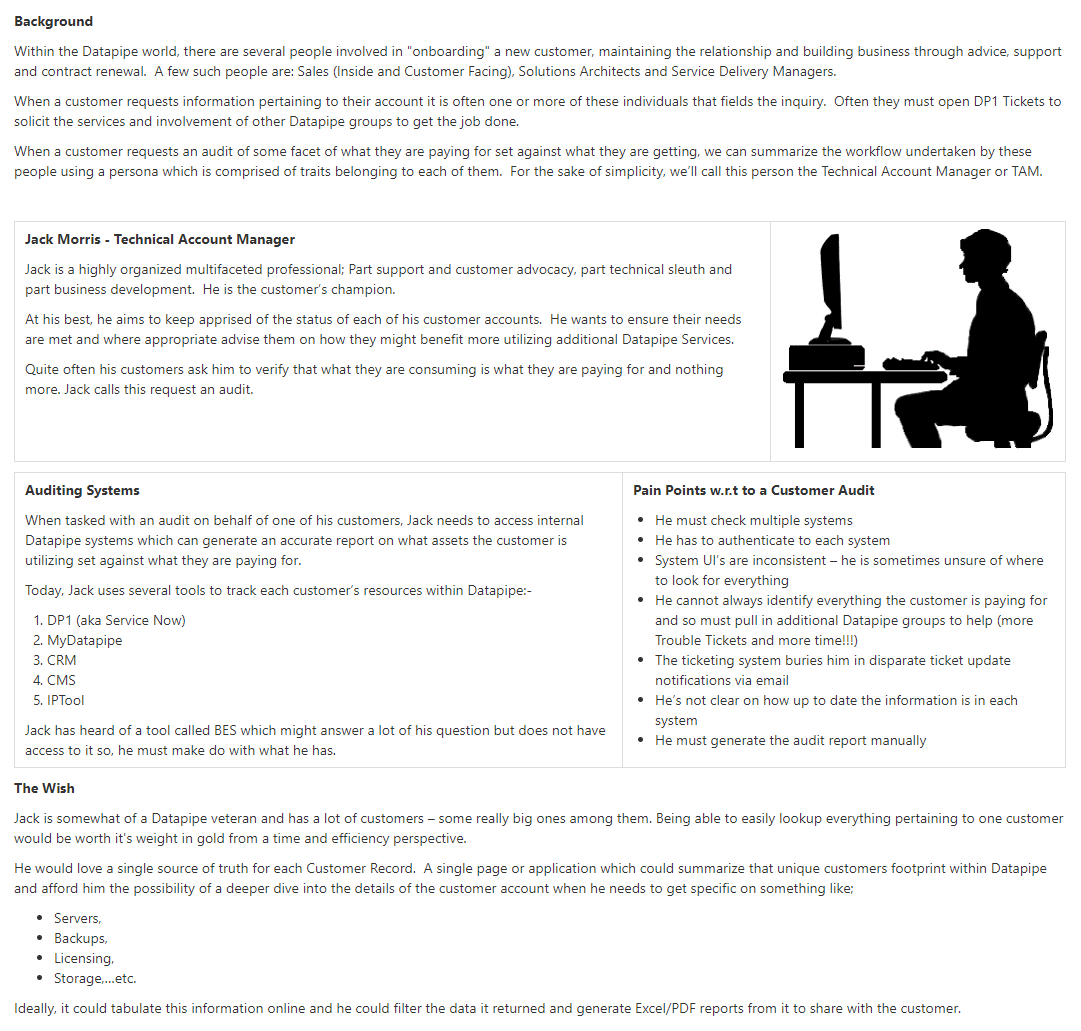
The Personas
OK, so I got to know my audience and to some extent the external demographics they served and the internal ones they answered to. Next, I created persona's to summarize our user types. This enabled us as a team to always be mindful of who we are designing the solution for. The personnel who would utilize this tool were divided into three groups:-
The Esoteric - The Gotchya
So things were goin' great until it became apparent that each Datapipe employee that might use this tool understood the Datapipe landscape differently. For example; The last 'billed for' month was the current month to some people and the previously completed month that was invoiced for, to others. Similarly, what was the definition of used versus paid for, for physical storage and virtual and how does this translate for thin client implementations and are these definitions shared and universally agreed upon by all for storage taken up by customer backups?? Confusion reigned.
The Resolution. I became a mediator of sorts. I gathered the differing party's into meetings and we agreed to define terms used within the application with a consistent, meaningful and agreed upon standard. I didn't expect this to be an issue and nor did anyone else. However, it had huge implications for how to consistently label and convey data munged together from two or more API's. It was essential that everyone agreed upon a standard language to describe the data. Without accord and a common understanding, it would be impossible to render succinct facts meaningfully and without ambiguity in the app.
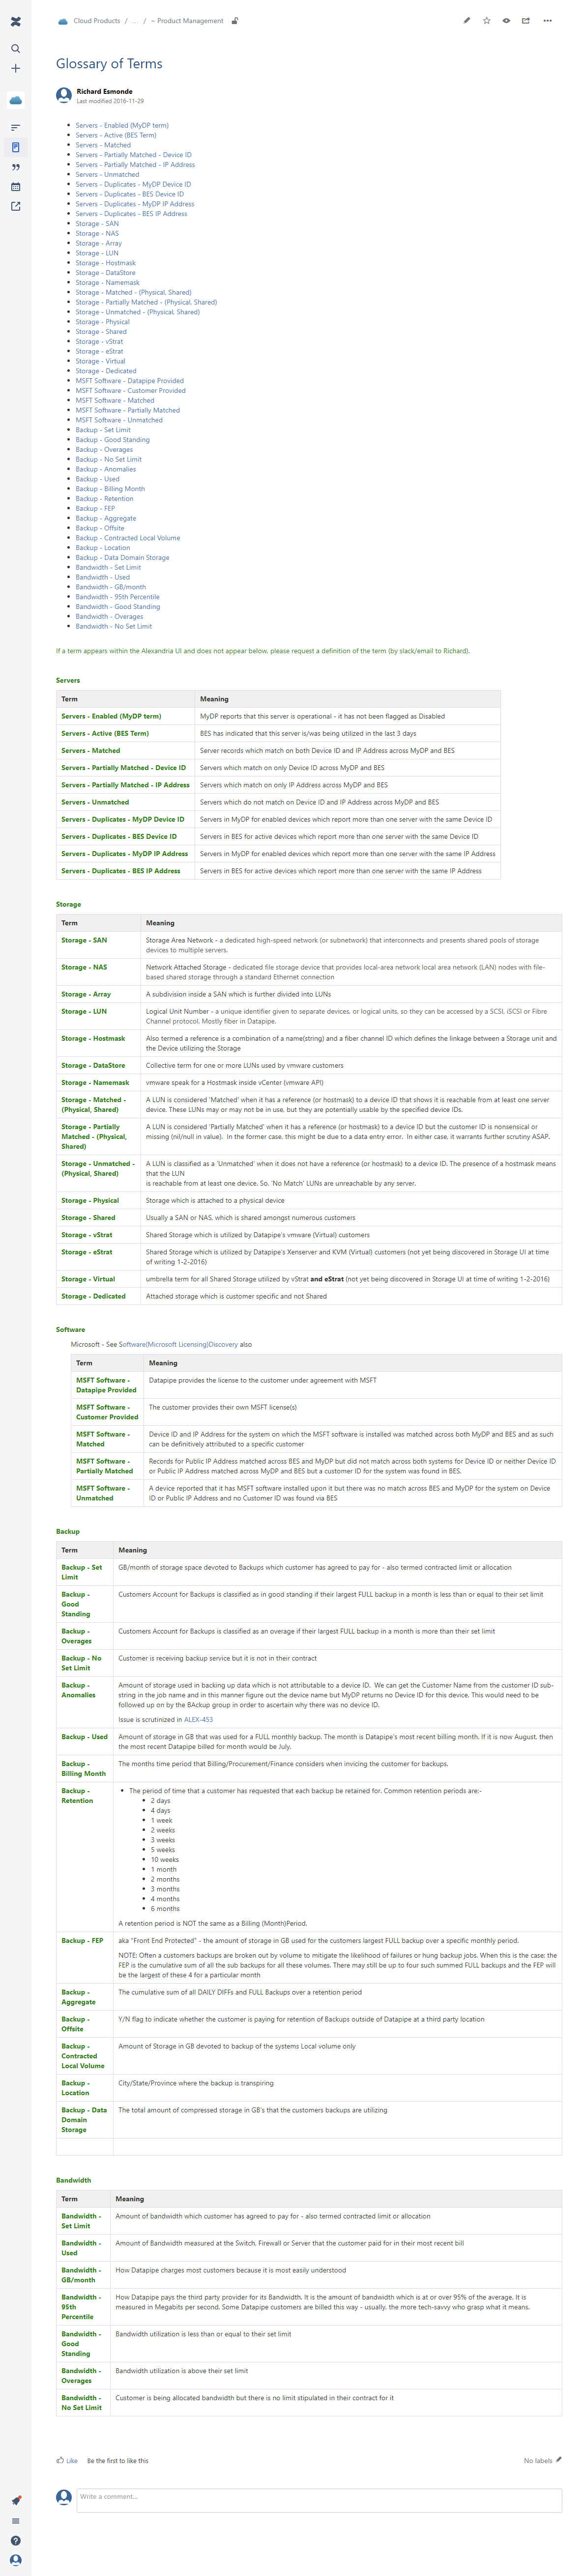
The net result was a Wiki page defining terminology - a glossary of terms for consensus
The Design Process
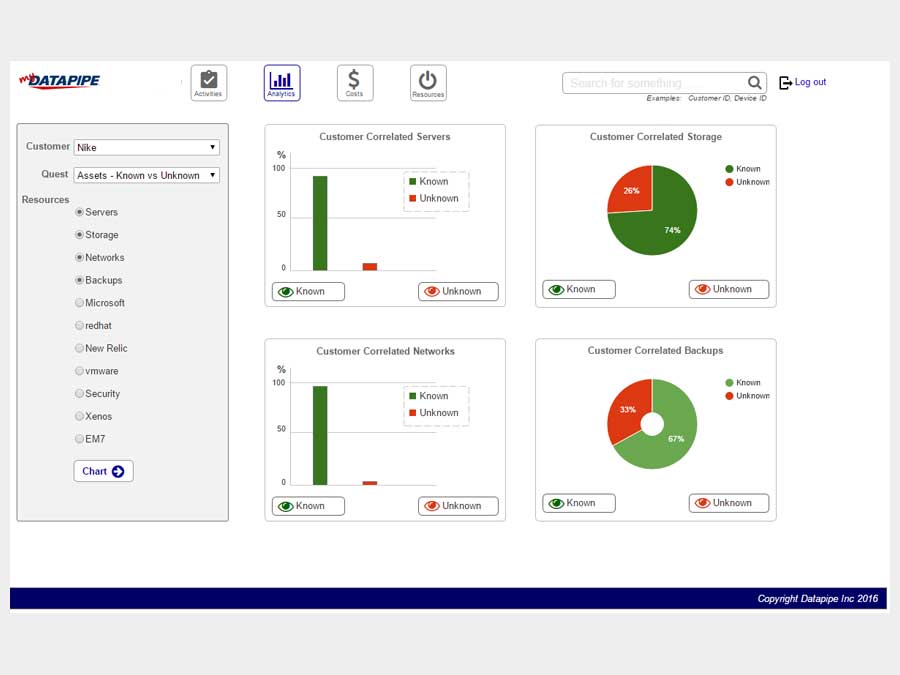
Datapipe wanted to understand what systems the customer was paying for and more particularly, what they were getting for free. Was Datapipe leaving money on the table and if so how much?
How might we visually summarize all this information? Concepts began life in the form of ideation-sketches, wireframes and what I refer to as protoframes - a mix of high fidelity wireframe and prototype. My audience were developers, executive stakeholders and requestors. I soon learned that wireframes were too visually intangible for the audiences I was presenting to - they needed color and and more aesthetic form to appreciate what was being conveyed, what they were to develop and who and what was involved.
There was a lot of data. I realized I would need to practice design simplicity in a Dieter-esque manner to simplify the tangled mess we were pulling back from all the API's. One of Herr Ram's 'Good Design' principles is "as little design as possible – Less, but better – because it concentrates on the essential aspects, and the products are not burdened with non-essentials. Back to purity, back to simplicity." Sounds like a plan - simplicity wrought from complexity - but easier said than done. Onwards!
We'd meet regularly as a team. Daily stand-ups to discuss status and issues and then more officially twice weekly. Every two weeks we'd present to executive committee (the sponsors, requestors and stakeholders) but to make sense of this chaos, each week was peppered with numerous on the fly meetings via Slack/Screen Hero/HighFive/Google Hangouts,...etc.
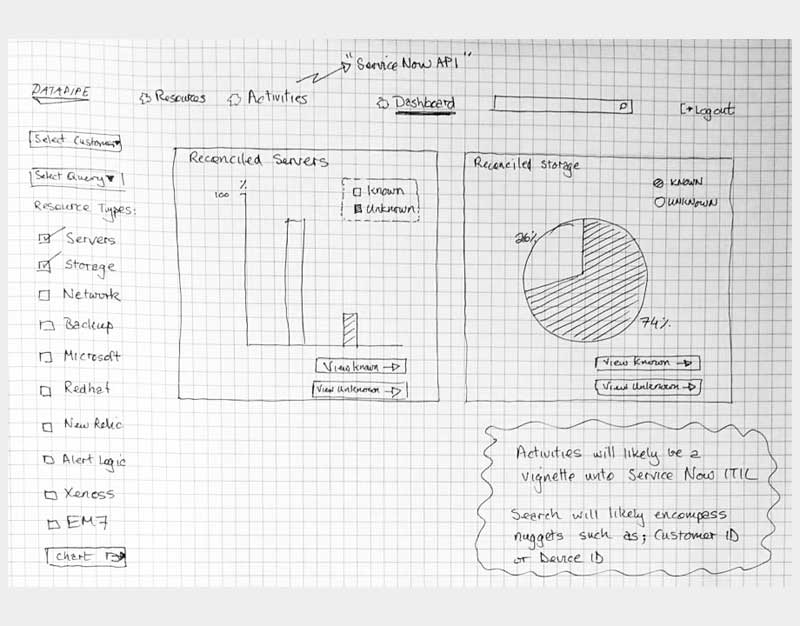
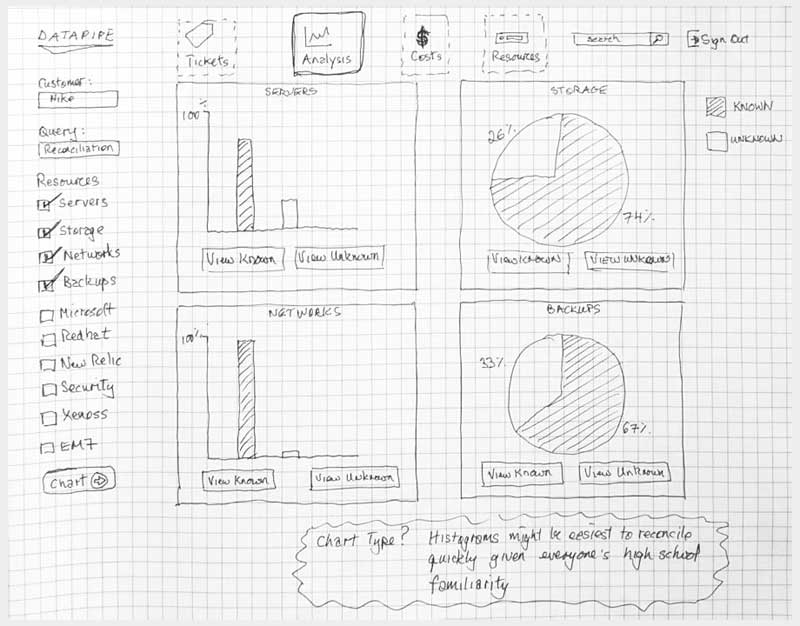
Ideations
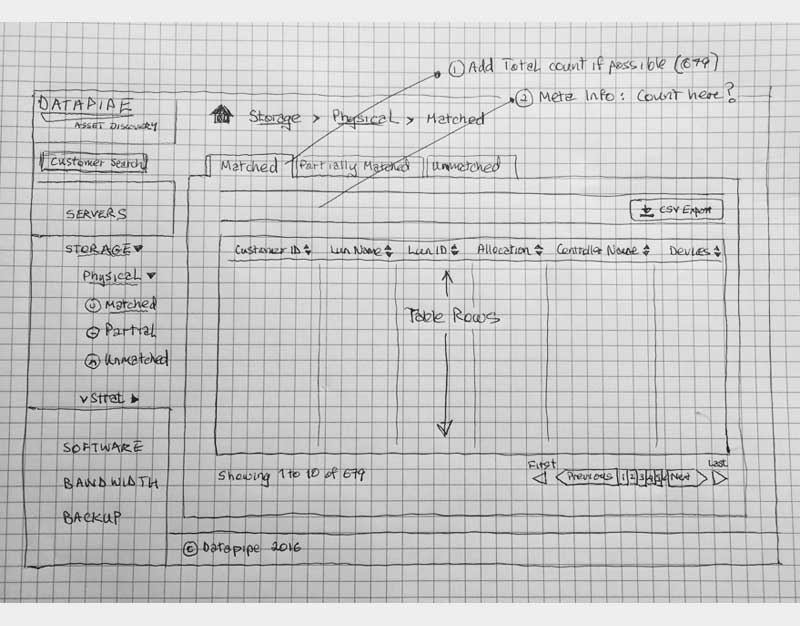
In truth, most of this happened on whiteboards but here are some sketches I salvaged from a pad
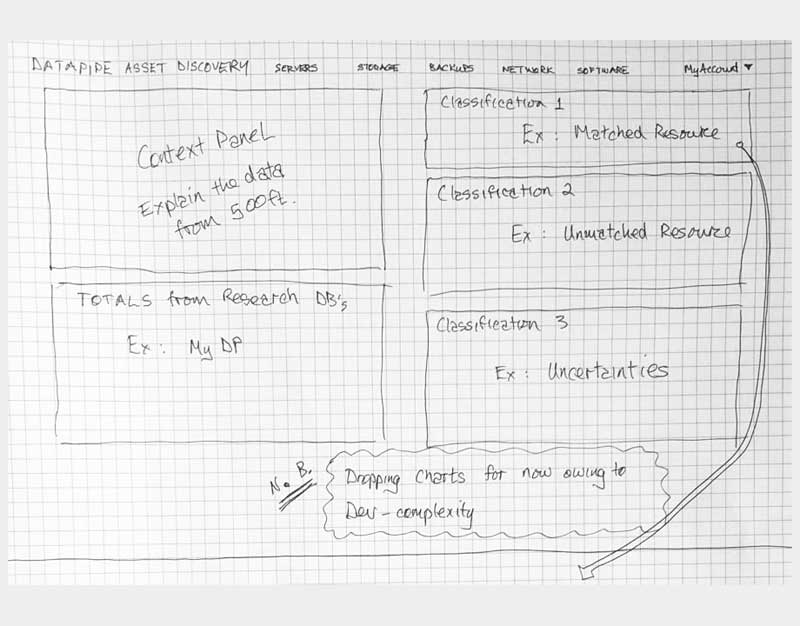
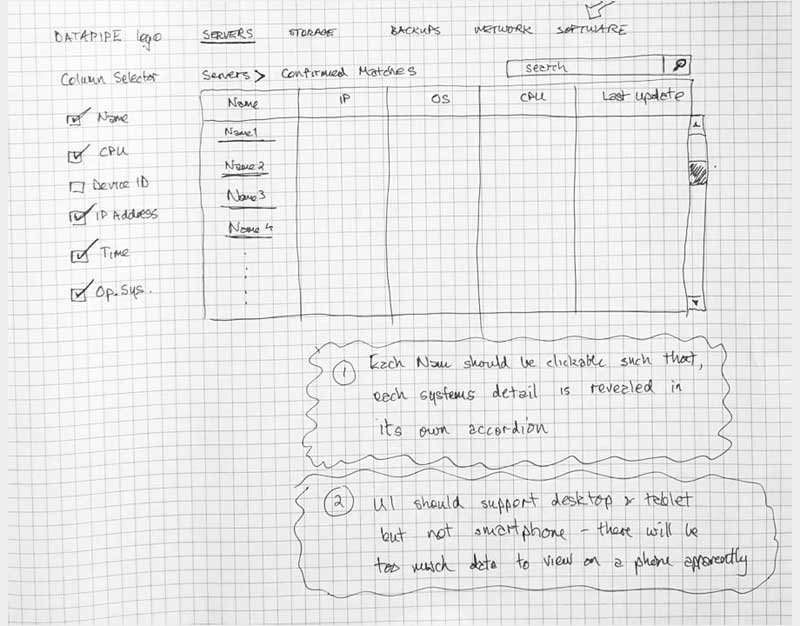
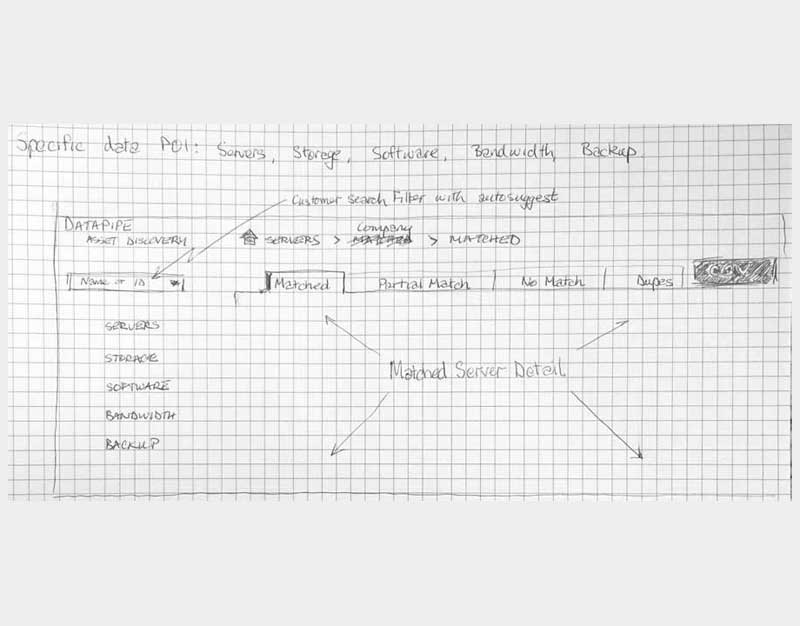

The Protoframes
The protoframe is part high fidelity wireframe and part click through prototype for presentation or testing. It is especially well received if you need to convey your design to a more visually needy audience.
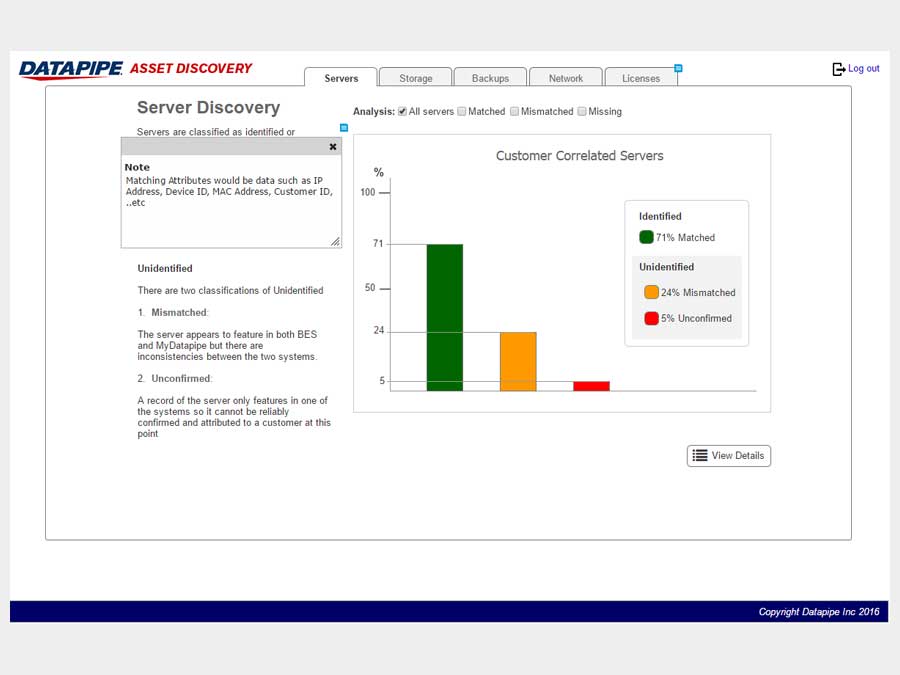
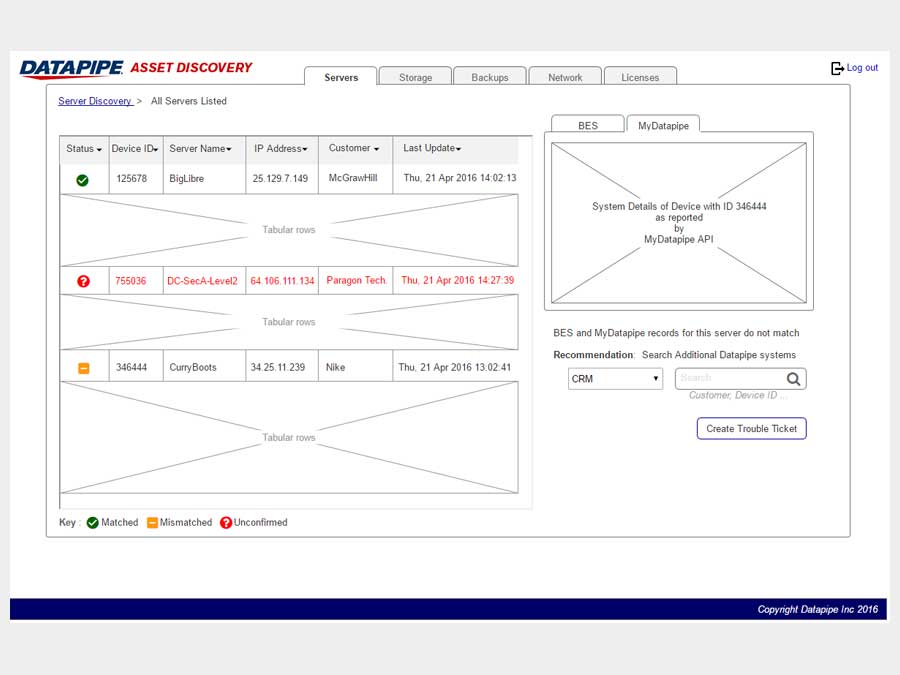
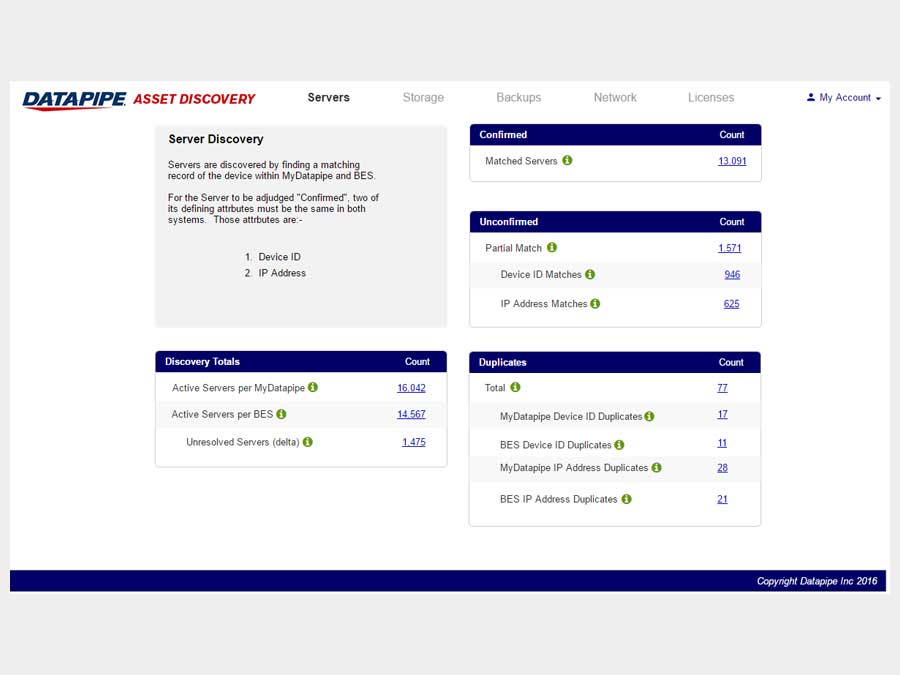
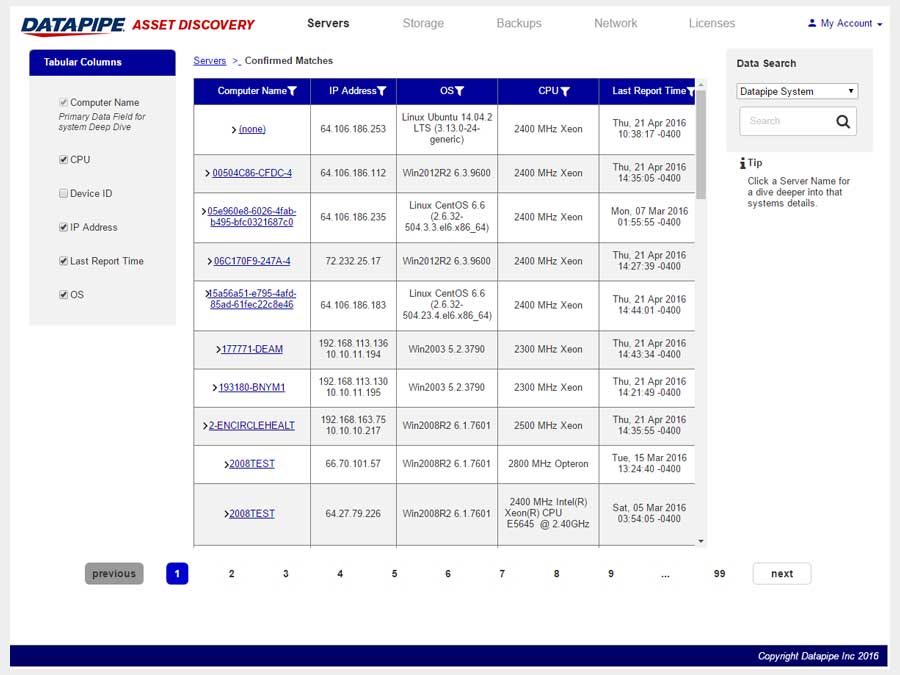
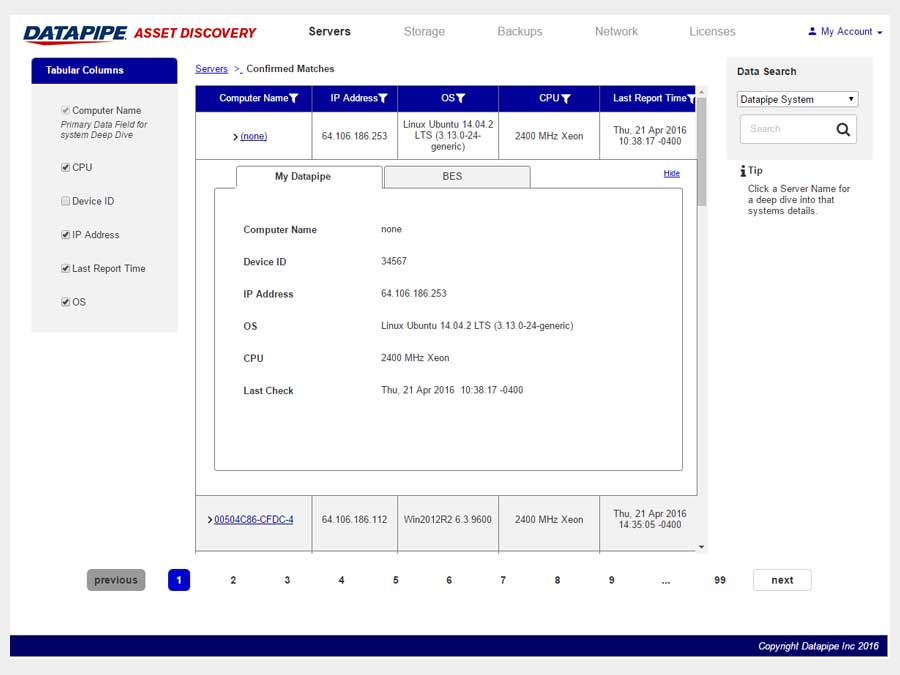
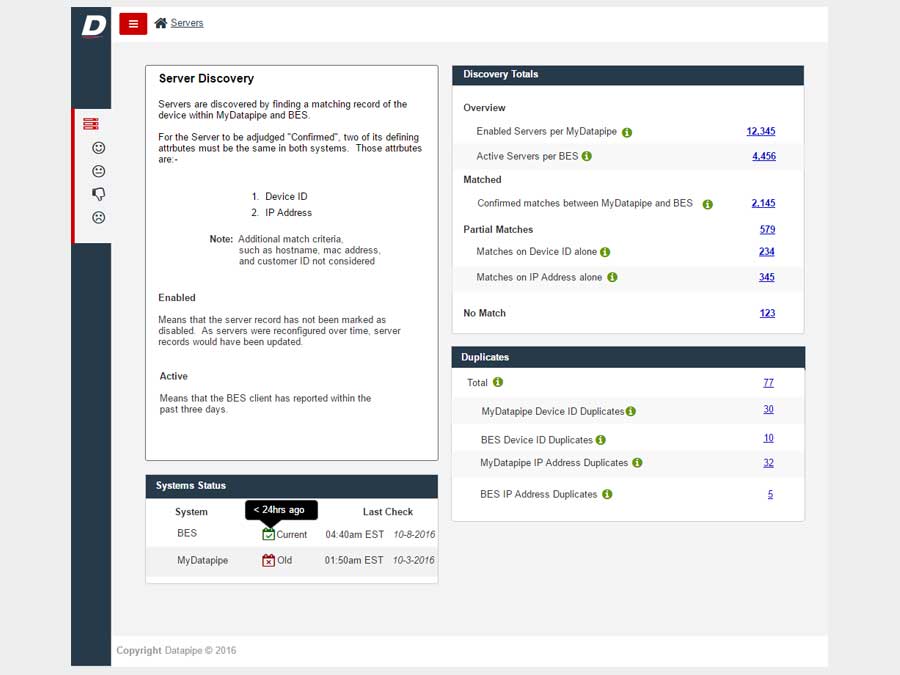
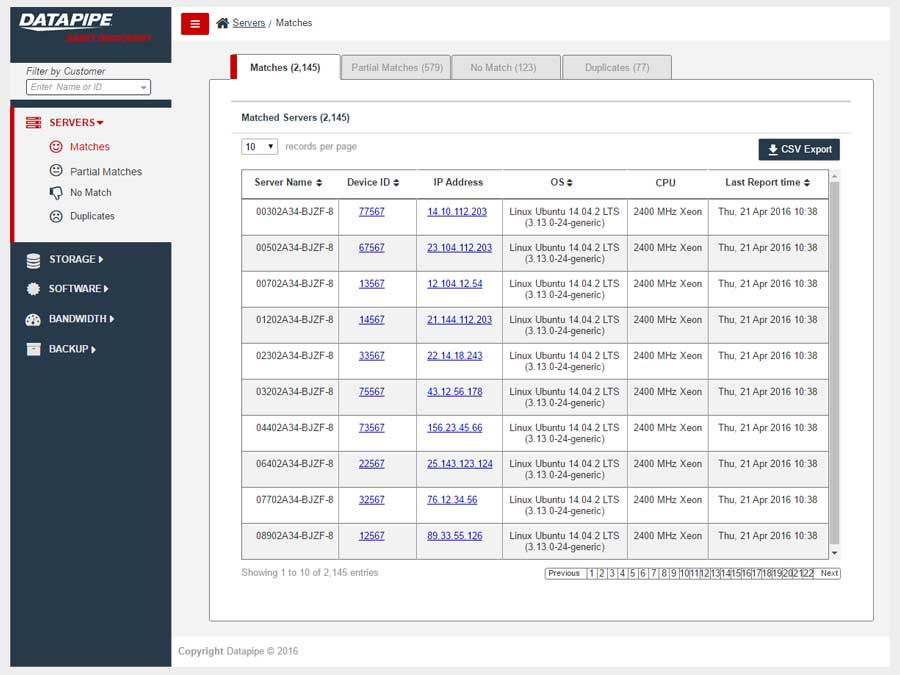
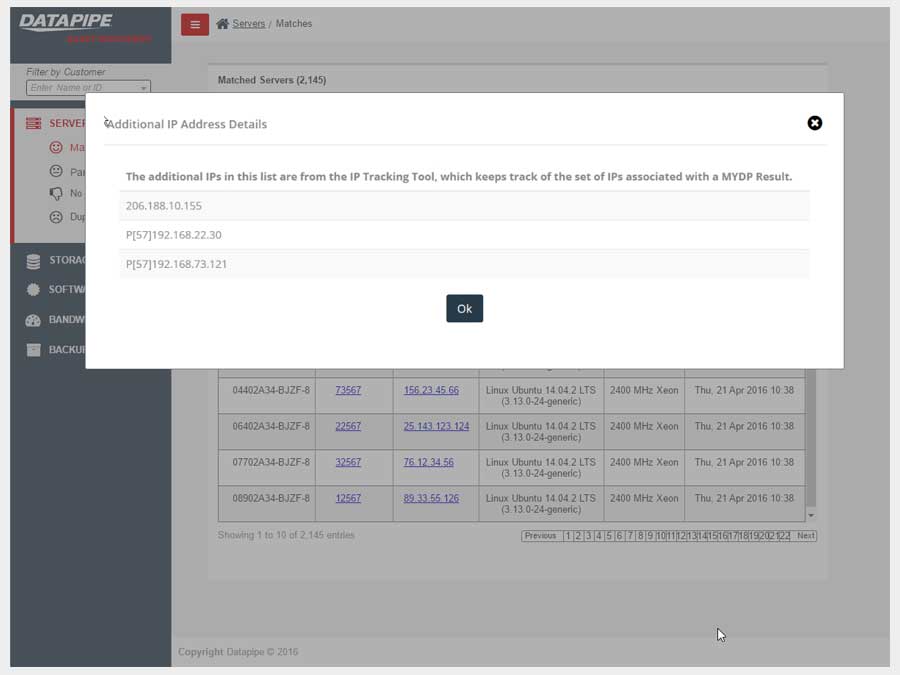
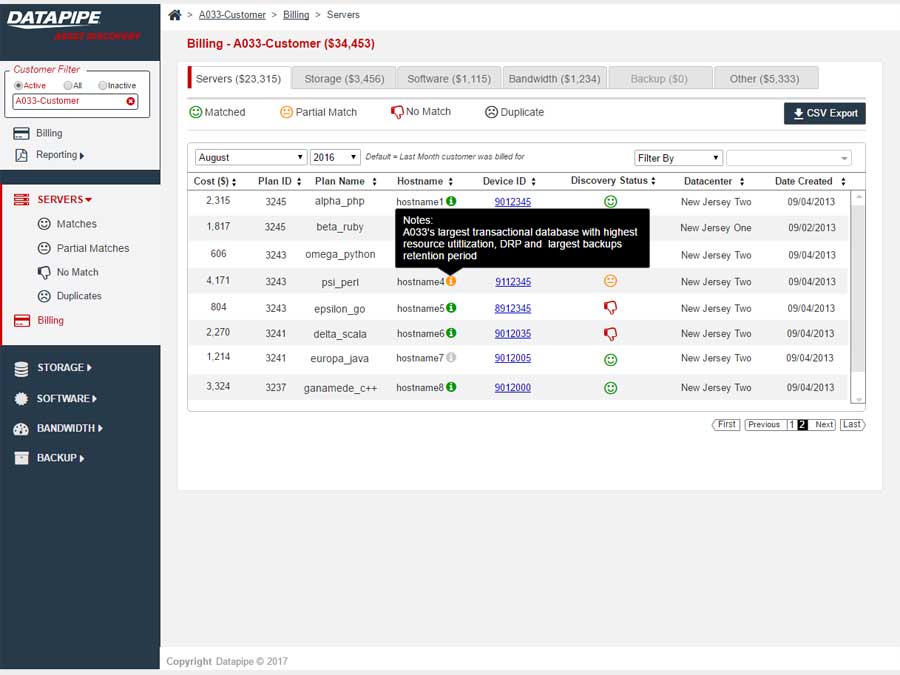
SERVERS
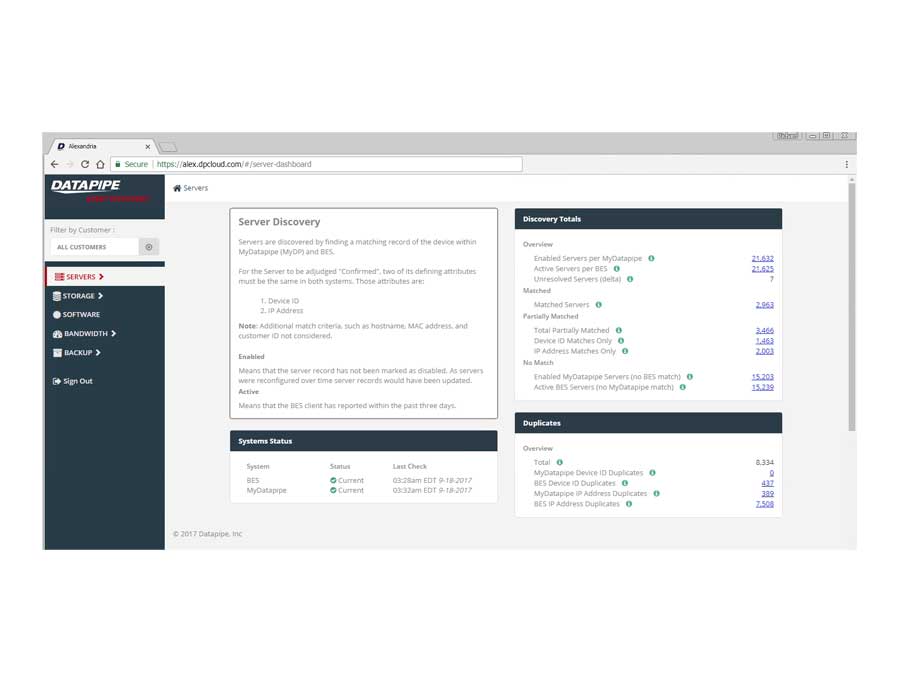
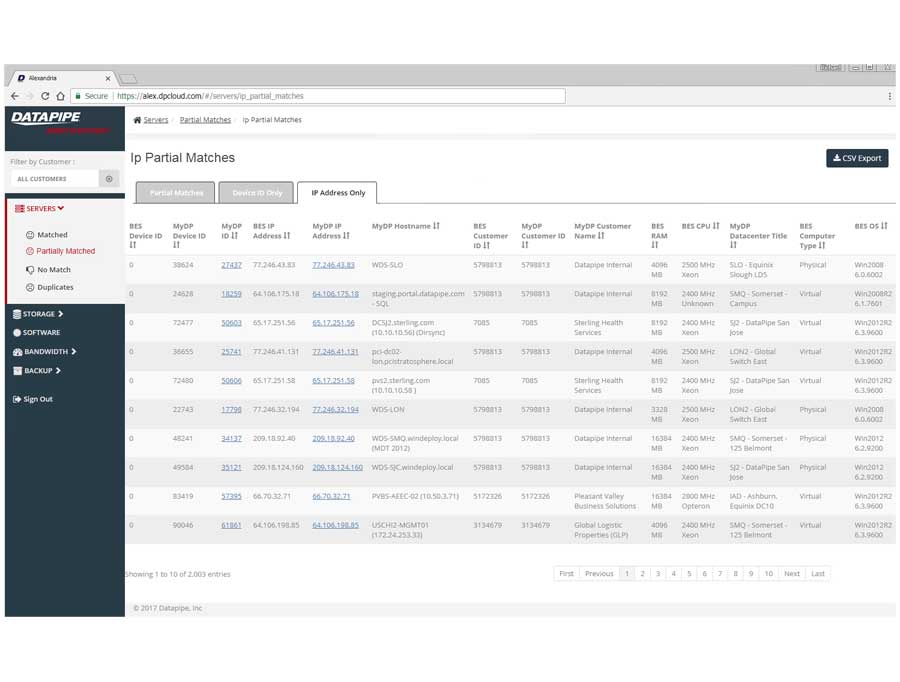
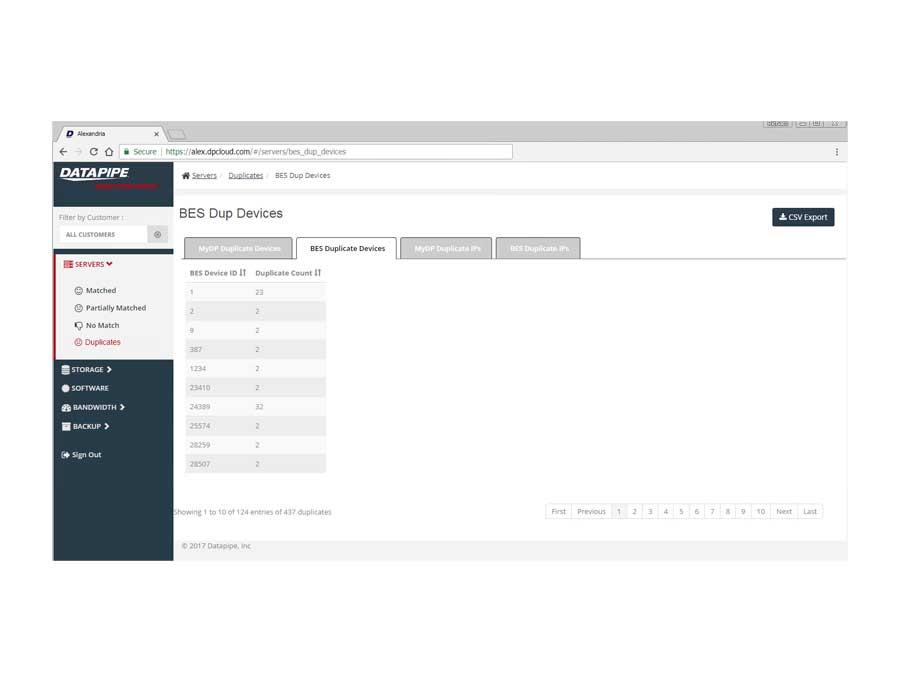
The design began with a focus upon Servers as their API's were most clear and accessible. It centered upon whether we could identity a resource as 100% belonging to a particular customer. So, it dealt with certainty. A server was adjudged to be active (on) and correlate-able with a customer if there was a record of it in two systems; My Datapipe a sort of in house Master record keeping Datapipe Admin tool and BES. As you'll see, owing to time and resources, some features never made it beyond the 'wouldn't this be nice phase.'
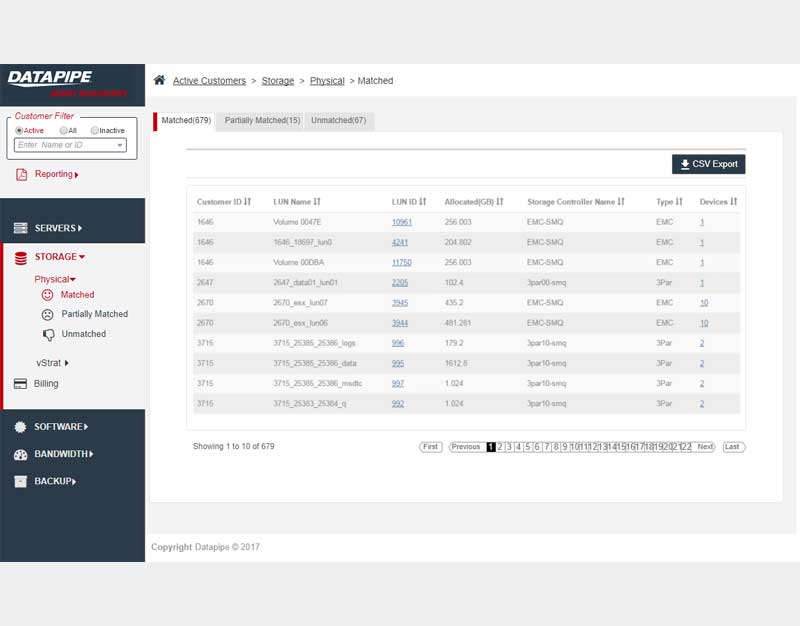
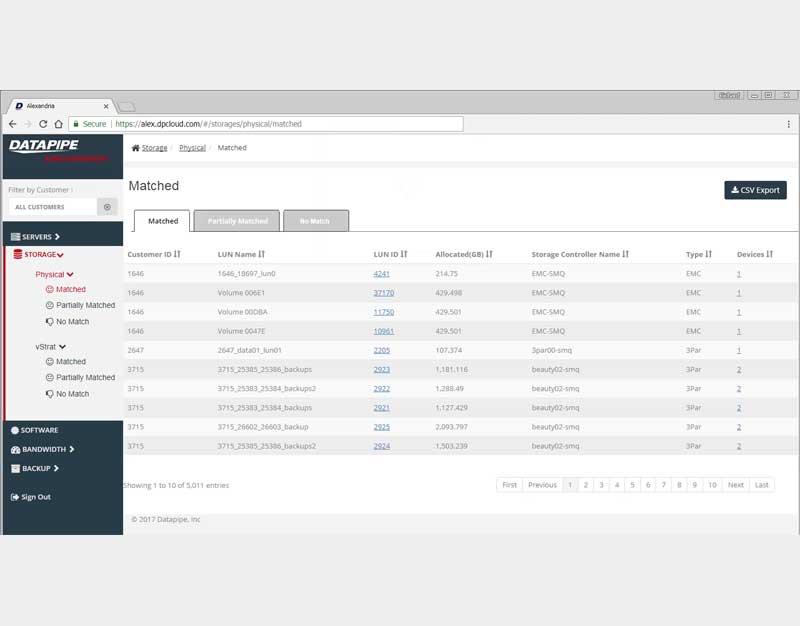
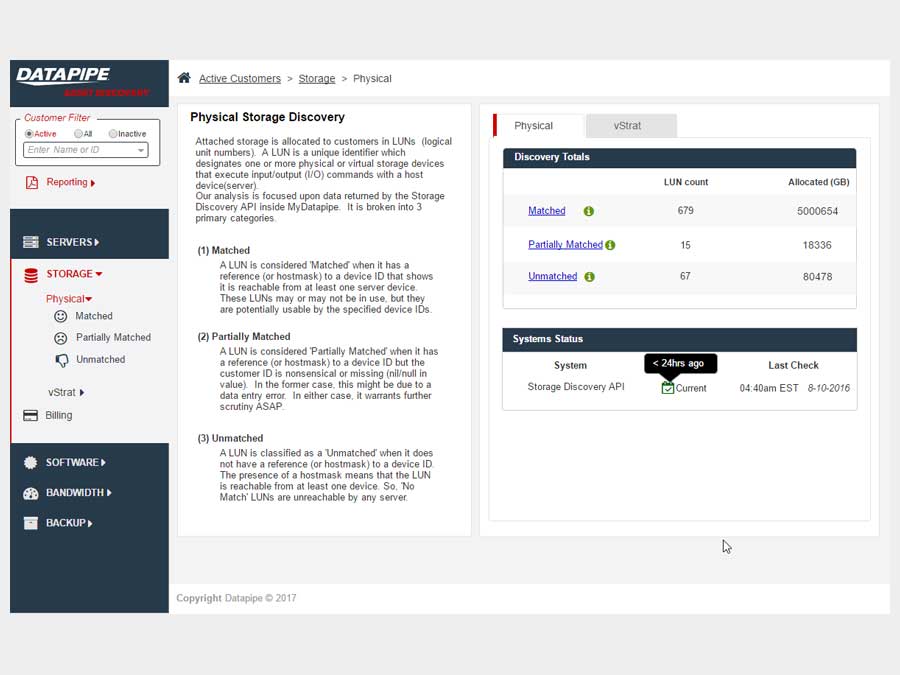
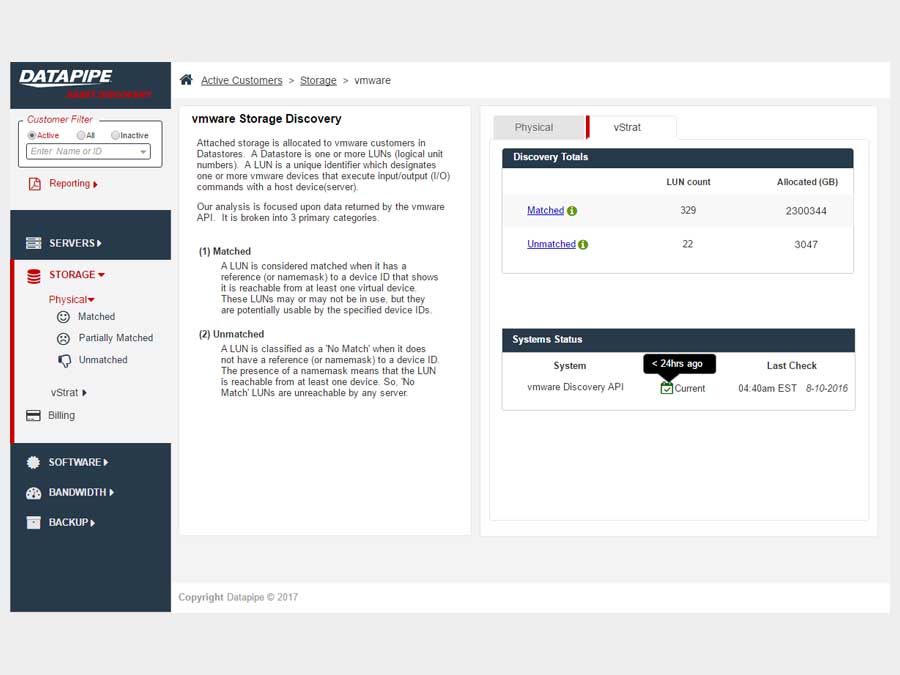
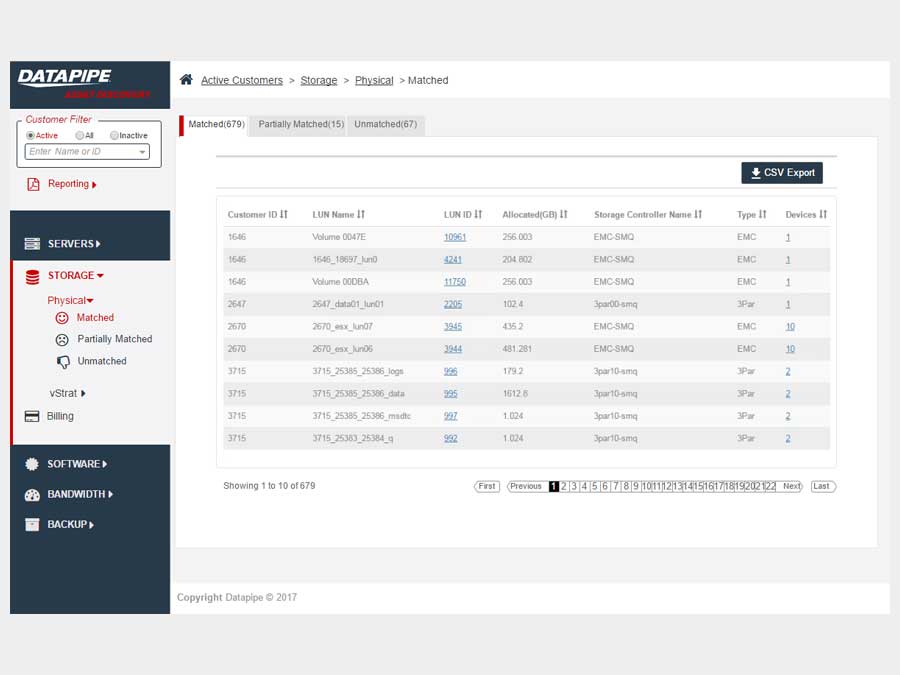
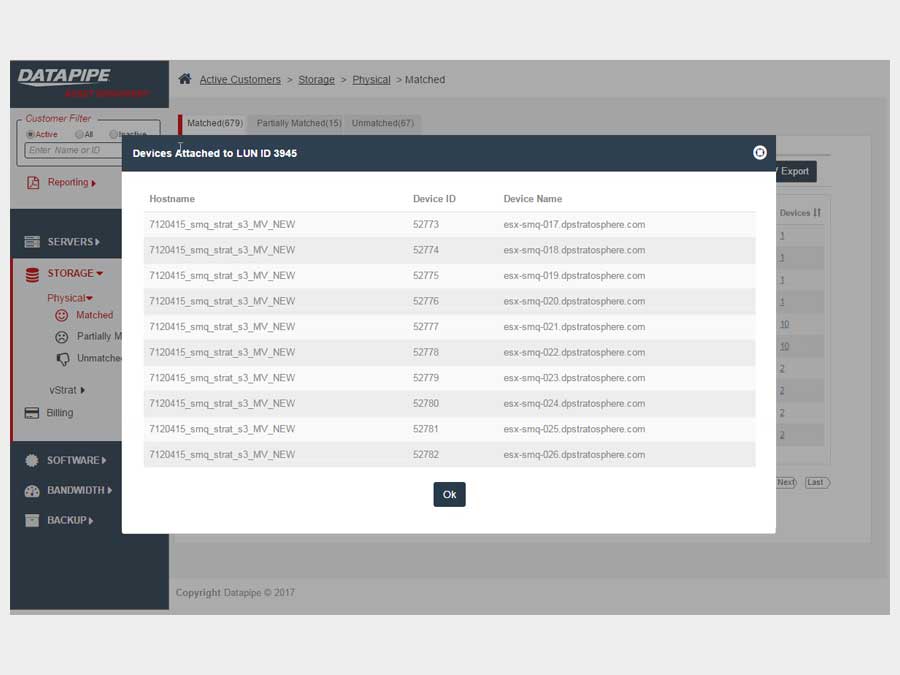
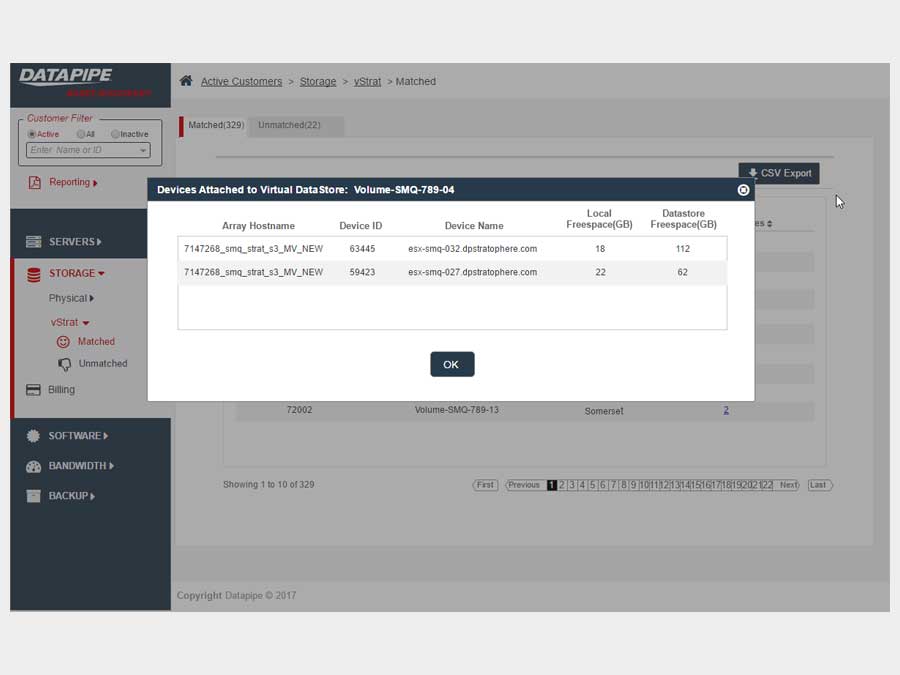
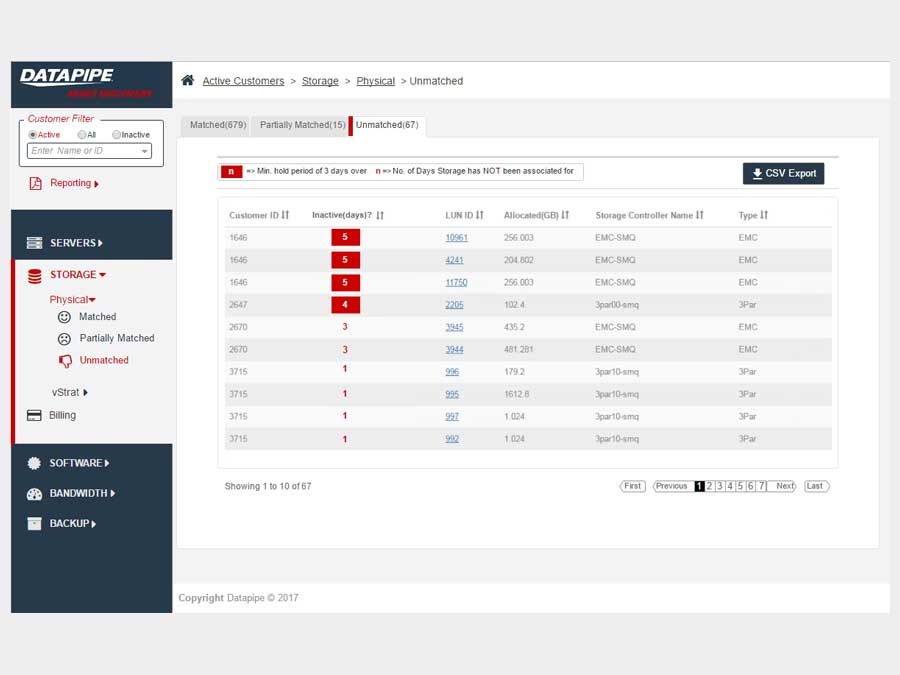
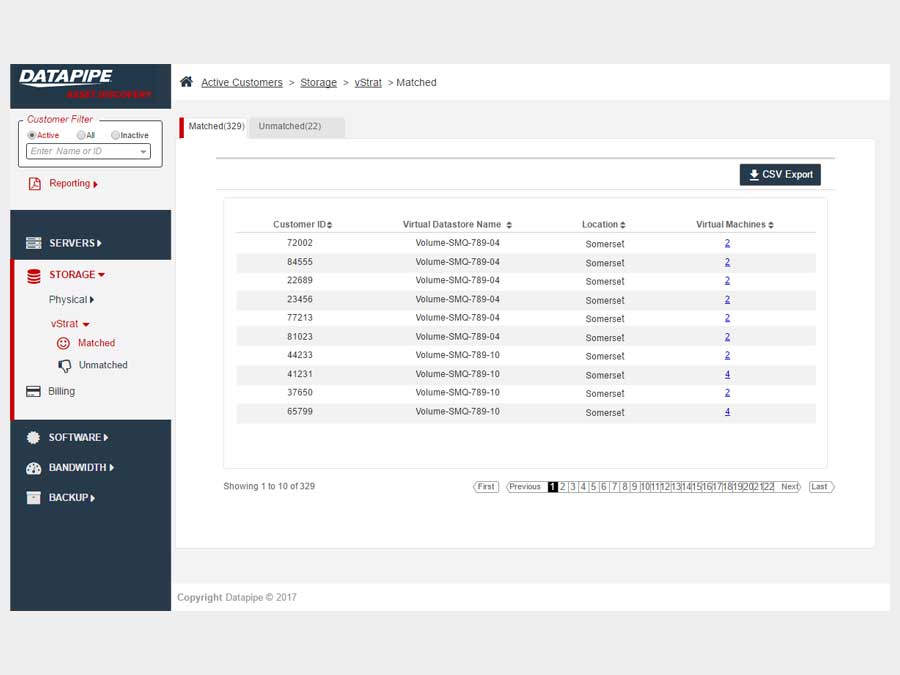
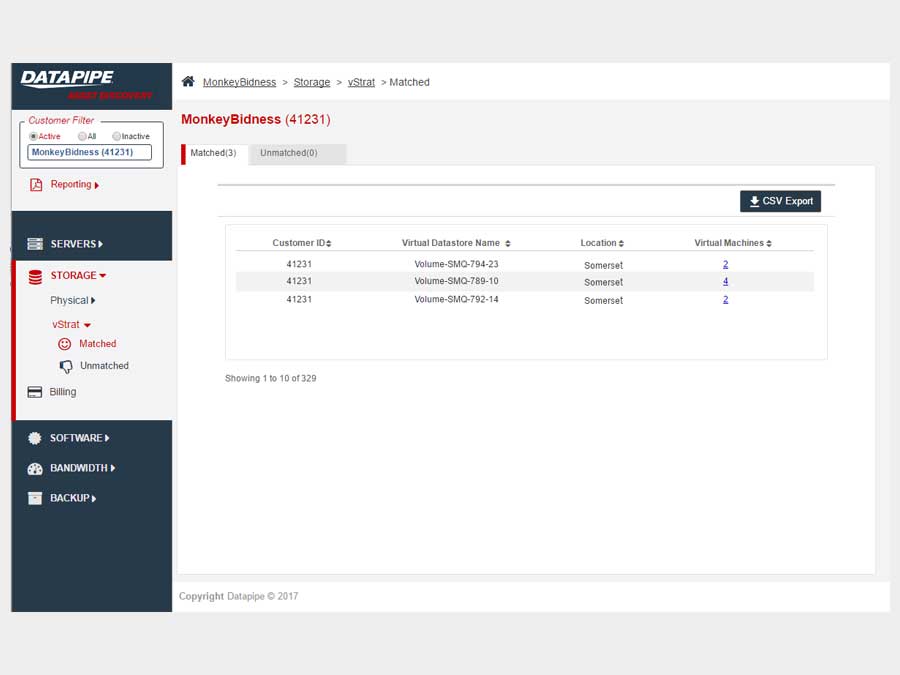
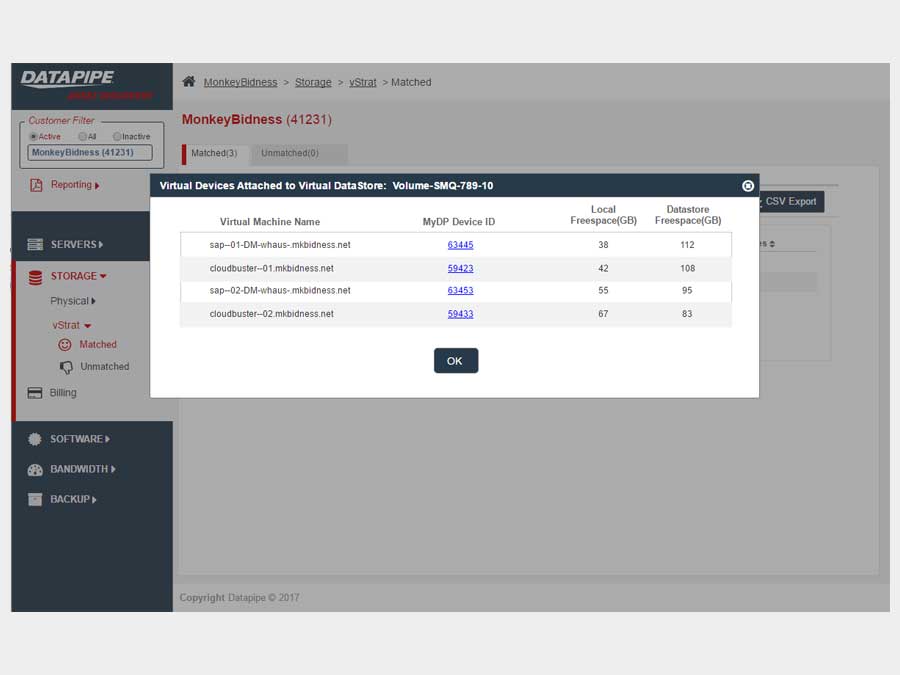
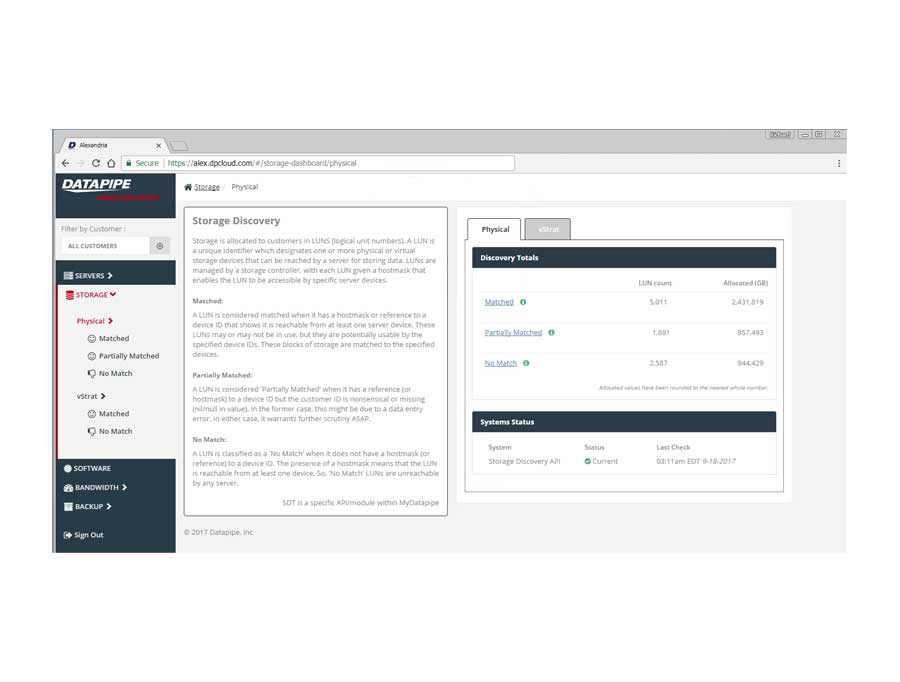
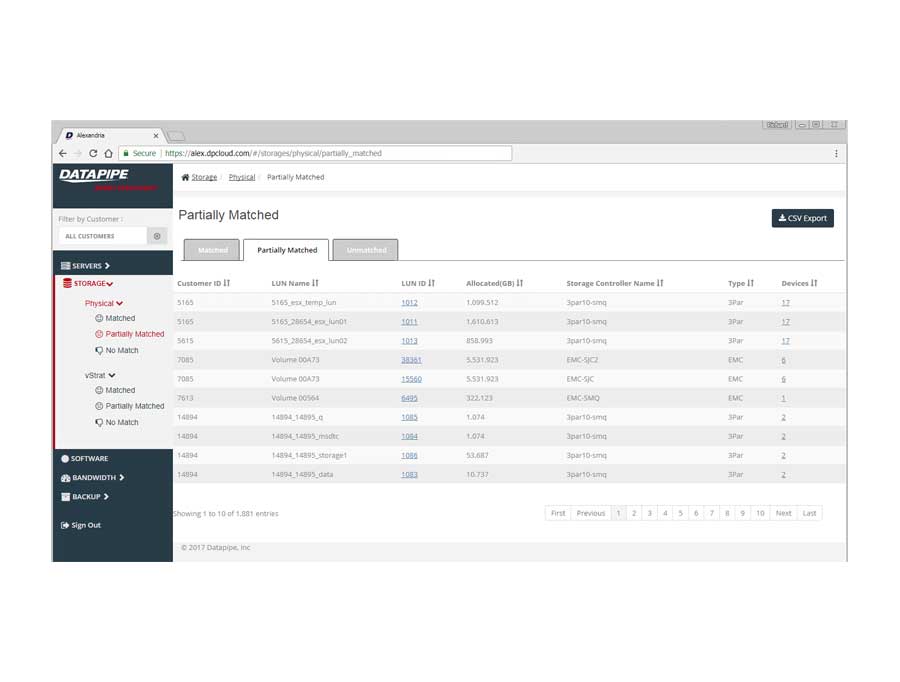
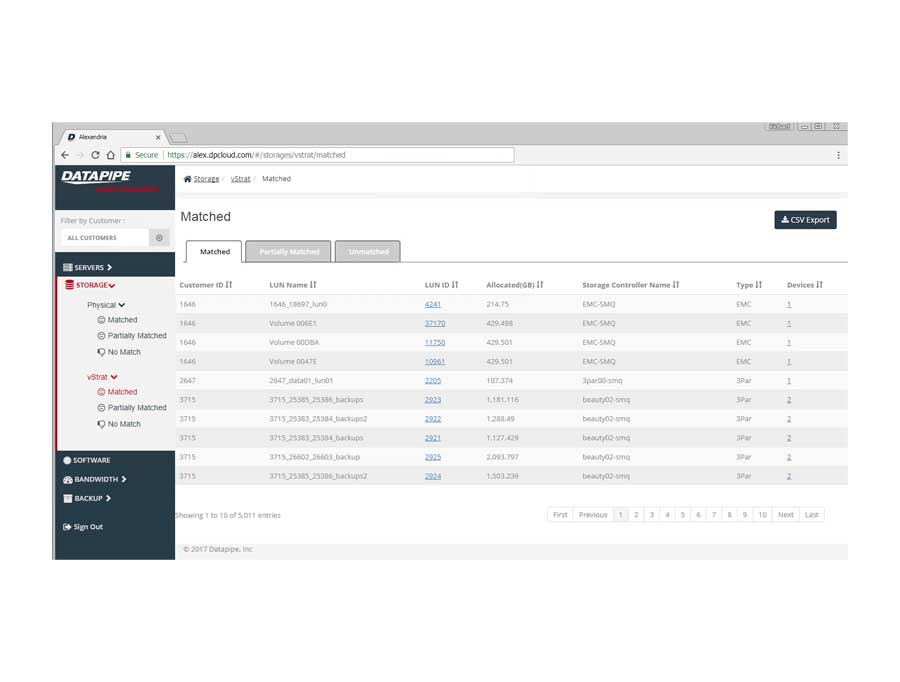
STORAGE
Storage analysis was a little more complex as different cloud vendors have different ways of implementing it. Physical storage utilized LUNs while vmware's cloud carves up their storage world into DataStores - similar but not the same so, much API confusion. By the time we'd emerged from SERVER analysis, we had settled upon a responsive template called 'Inspinia' which was Angular compliant(an engineering requirement). We saved a lot of time by purchasing the template as opposed to having our front end team code one up. They were too busy already with the machinations of disparate vendors API's

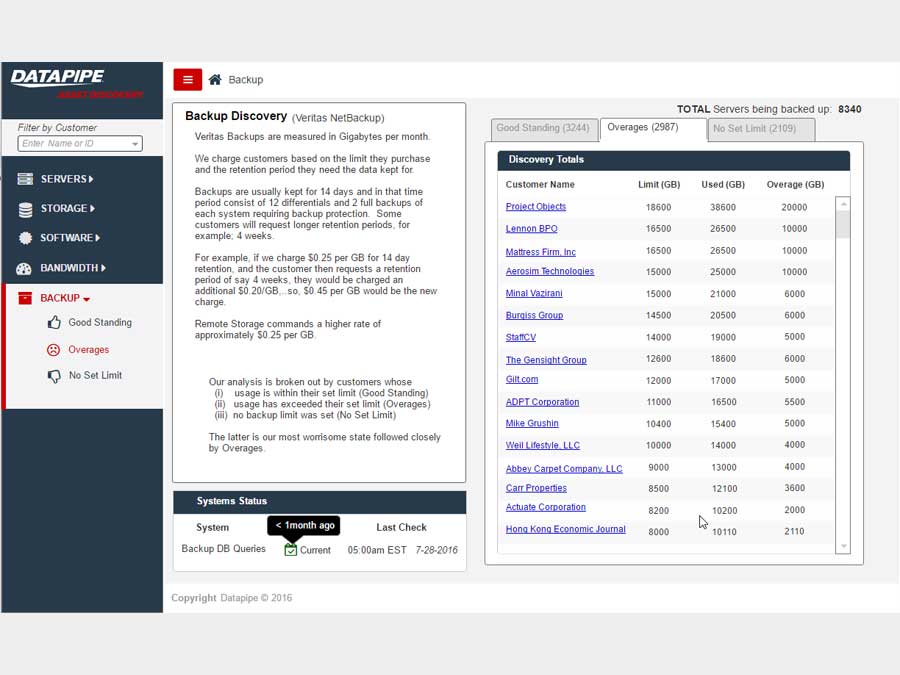
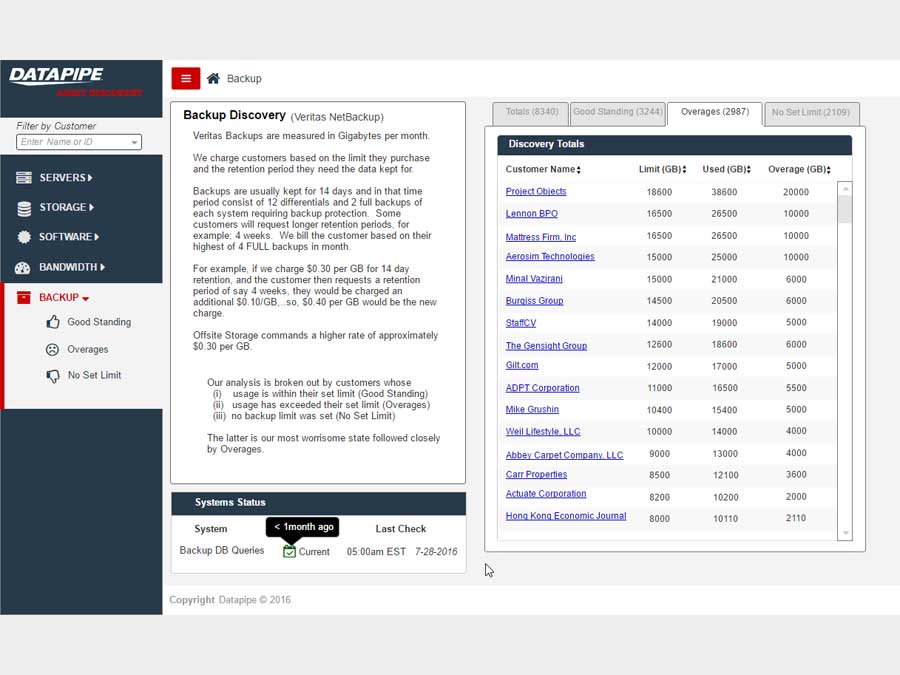
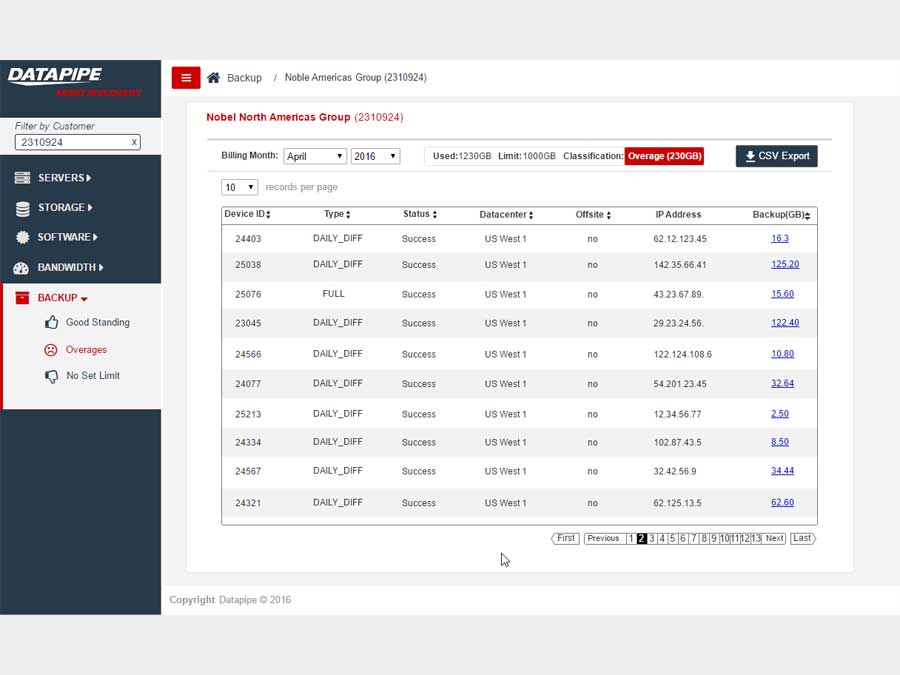
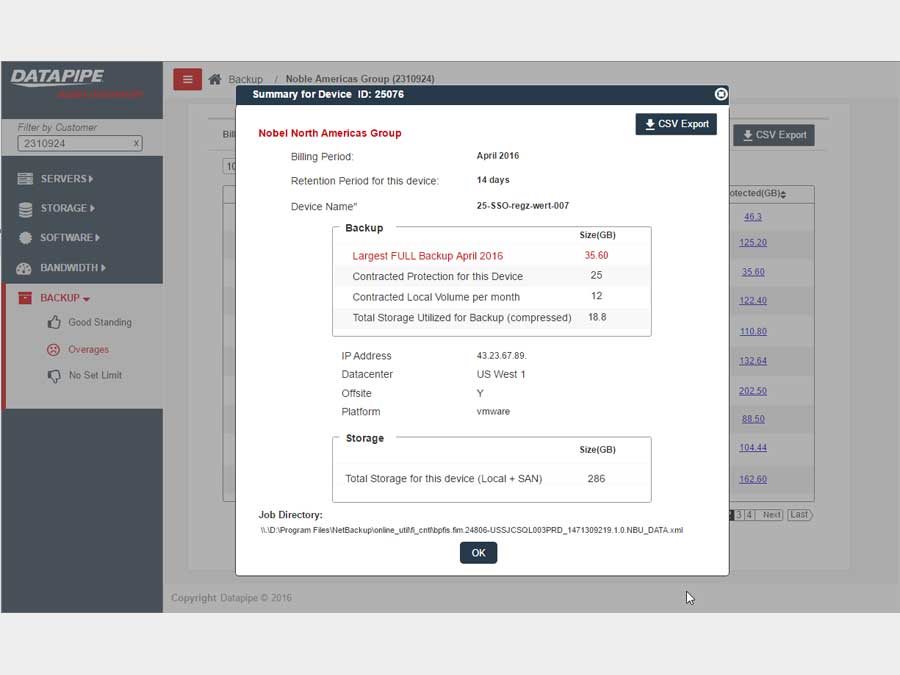
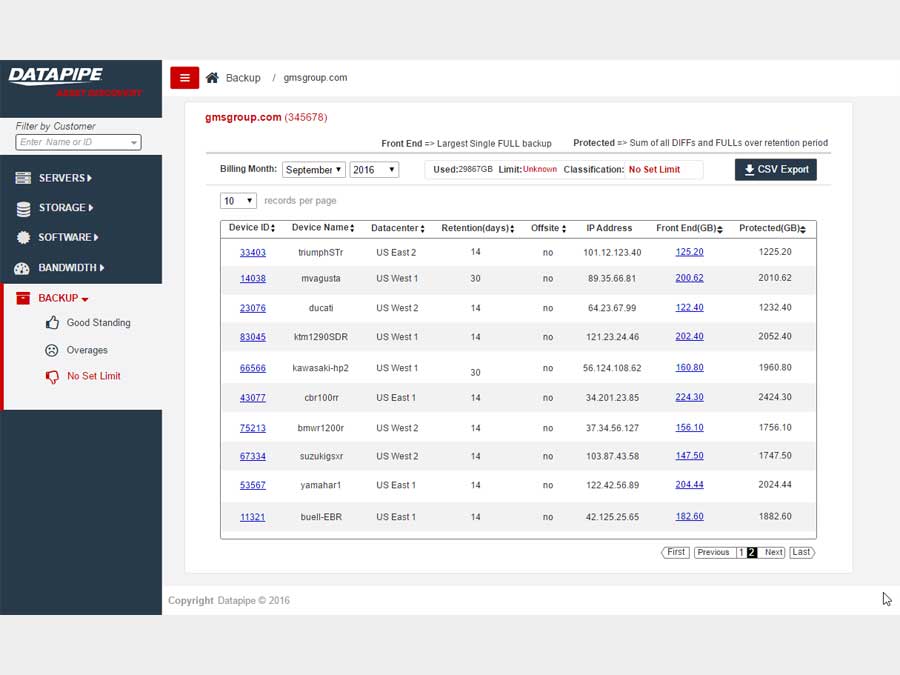
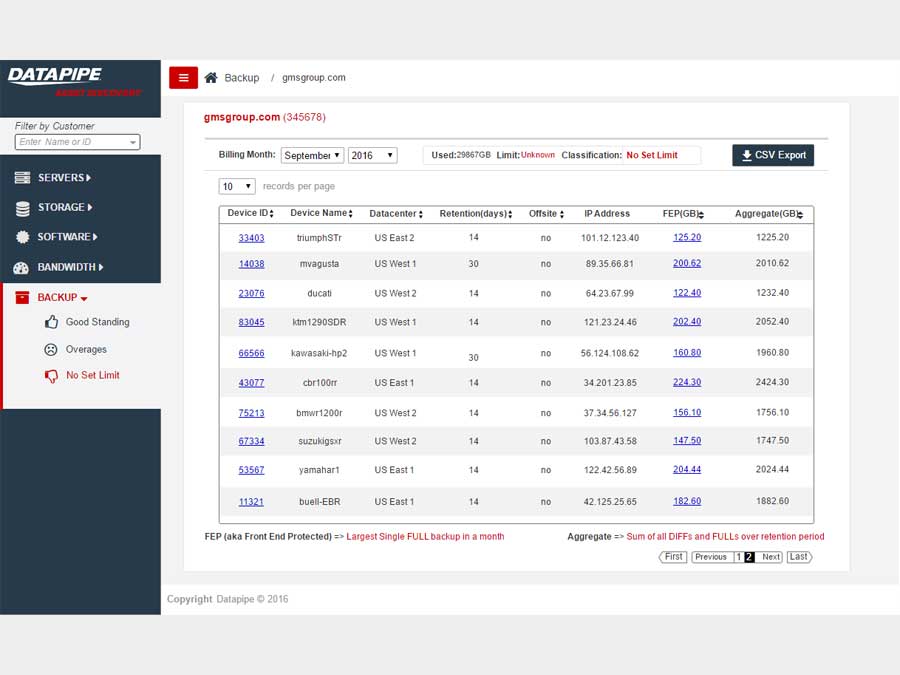
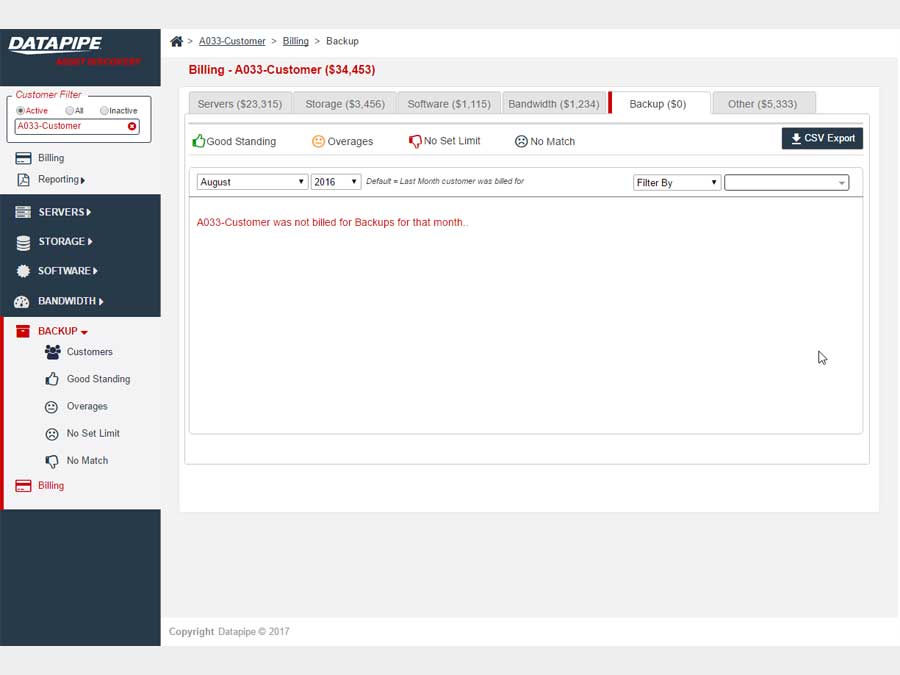
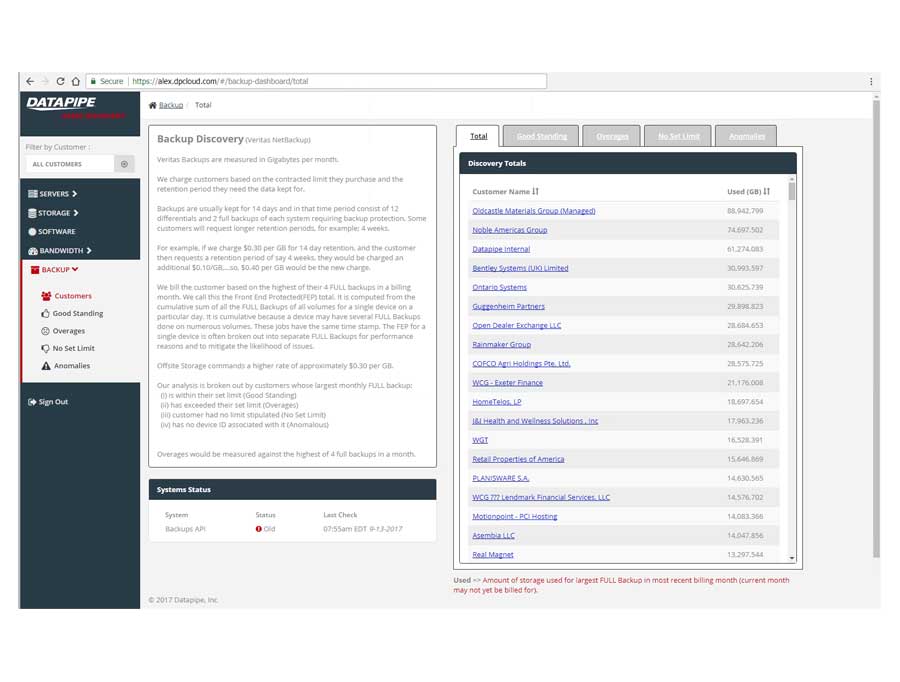
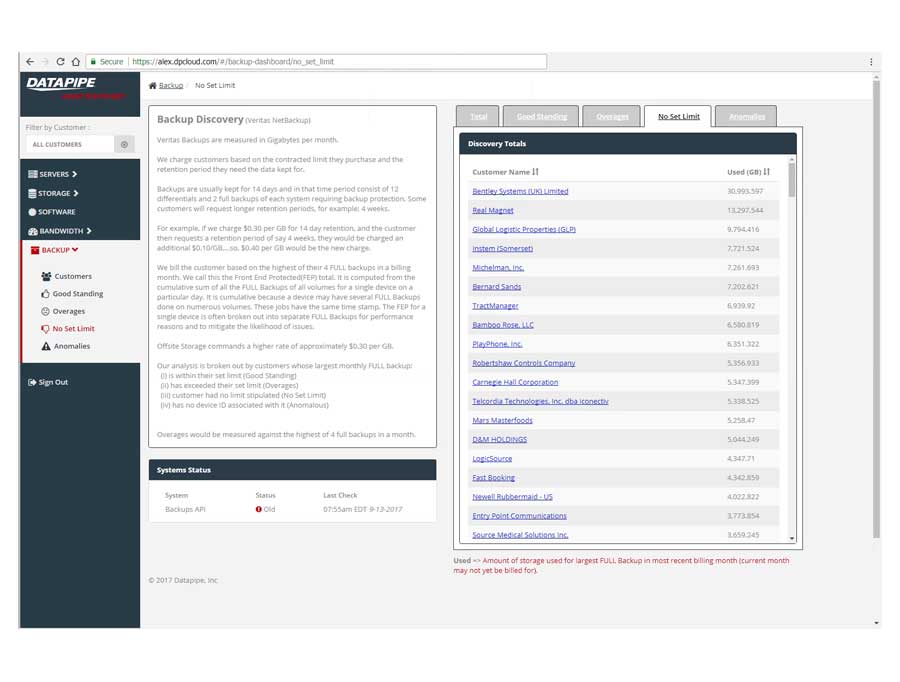
BACKUPS
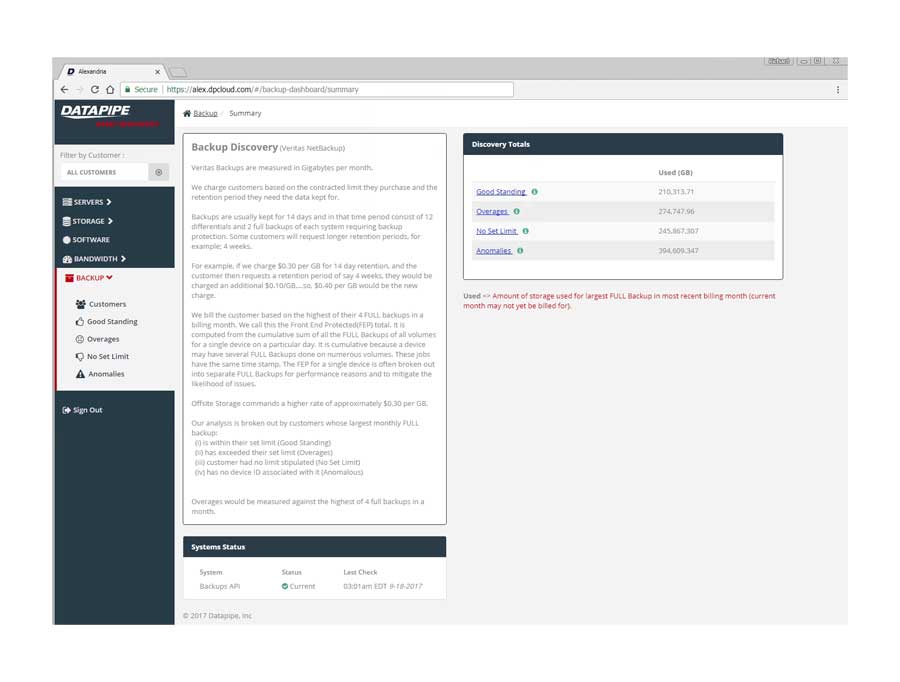
For backups, we strayed deeply into the esoteric nature of how Datapipe considers and describes the backup service for a customer and in particular, how the various internal groups consider and classify them. Misunderstandings surrounding what the term Front End Protected(FEP) meant and what time period it applied to in terms of billing were the main bones of contention
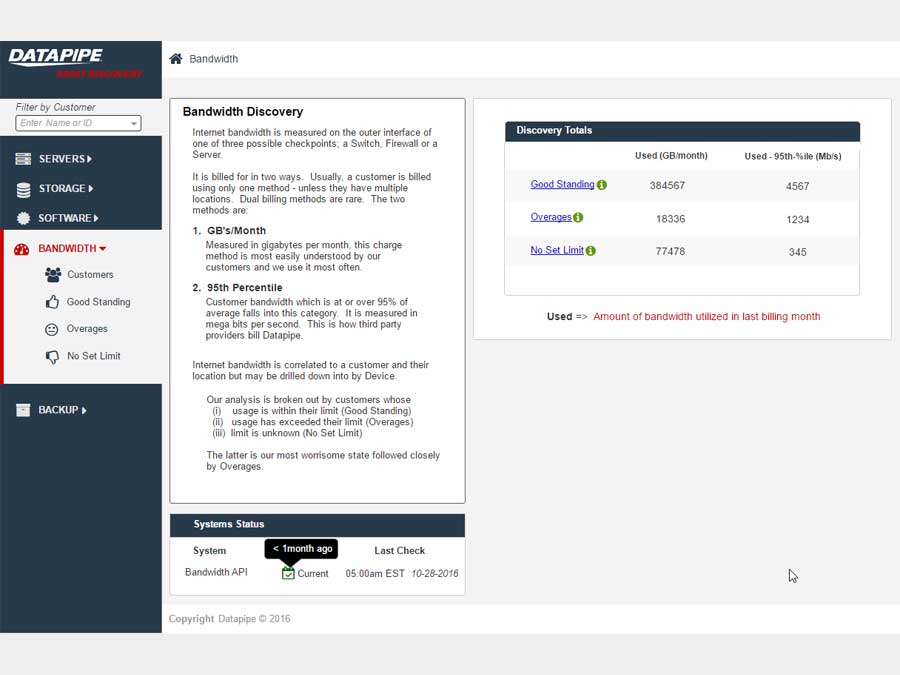
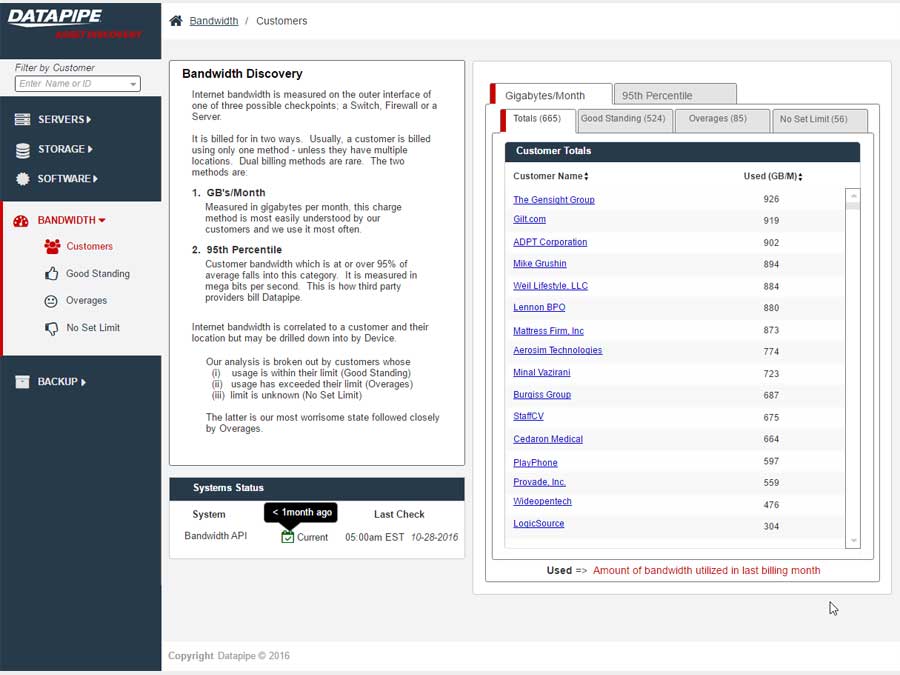
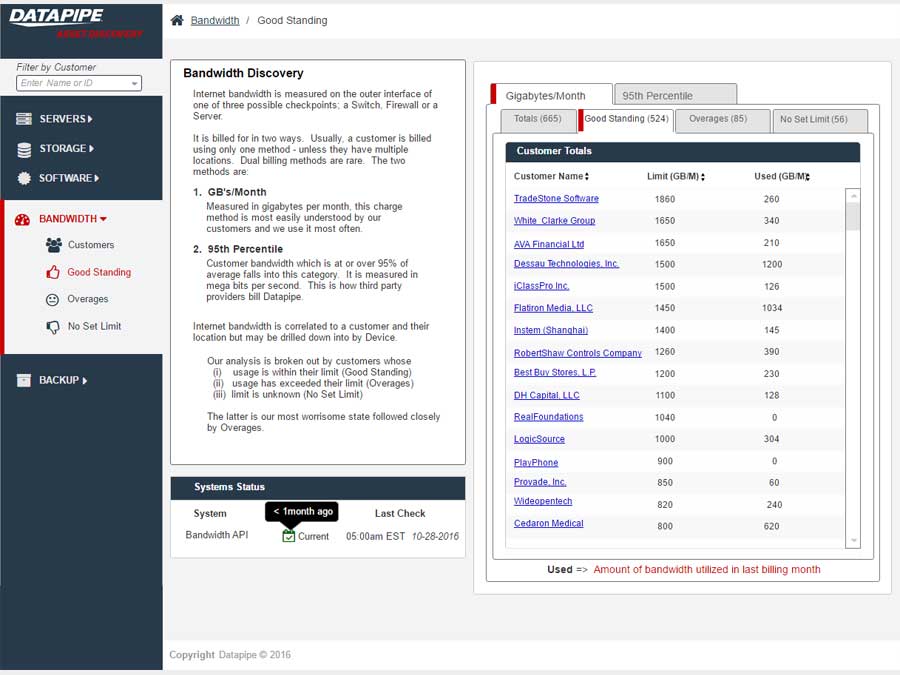
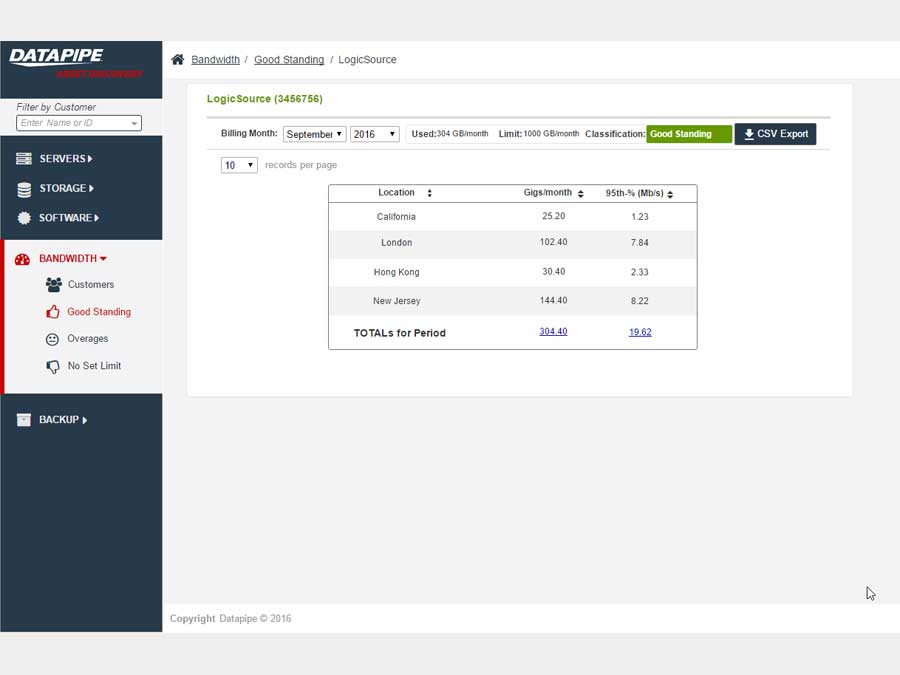
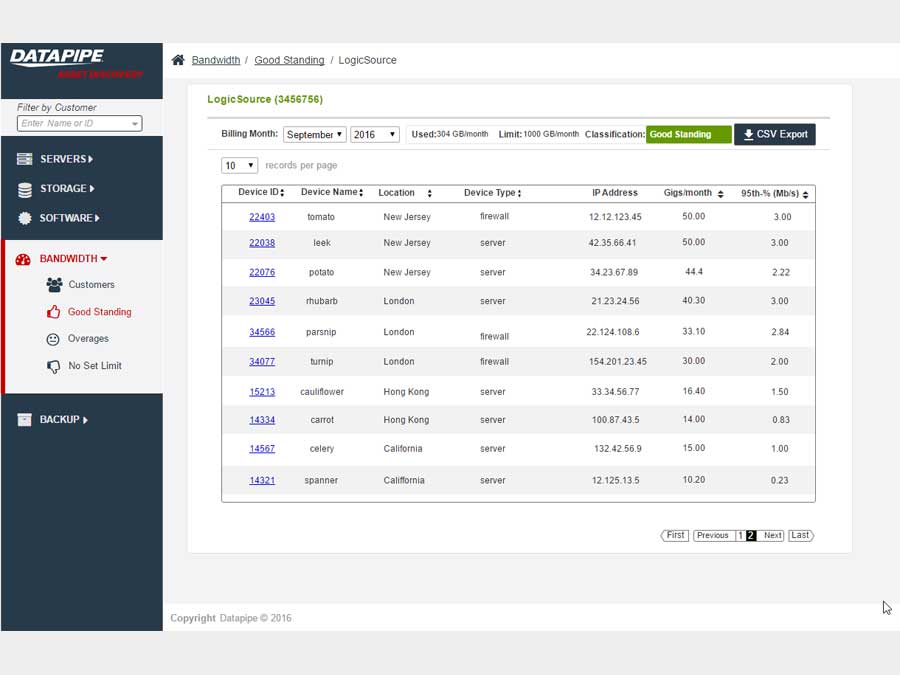
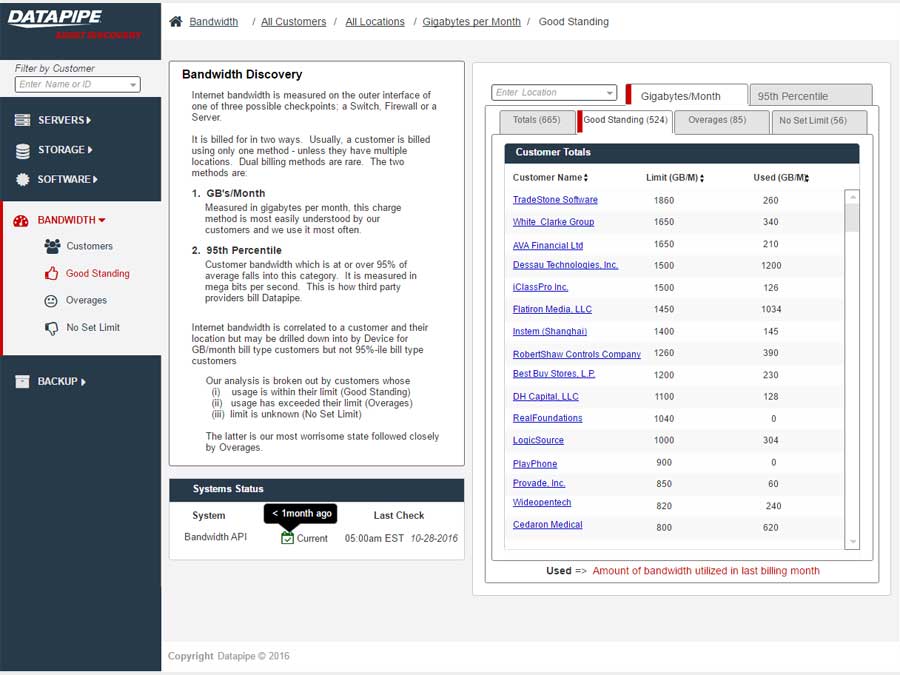
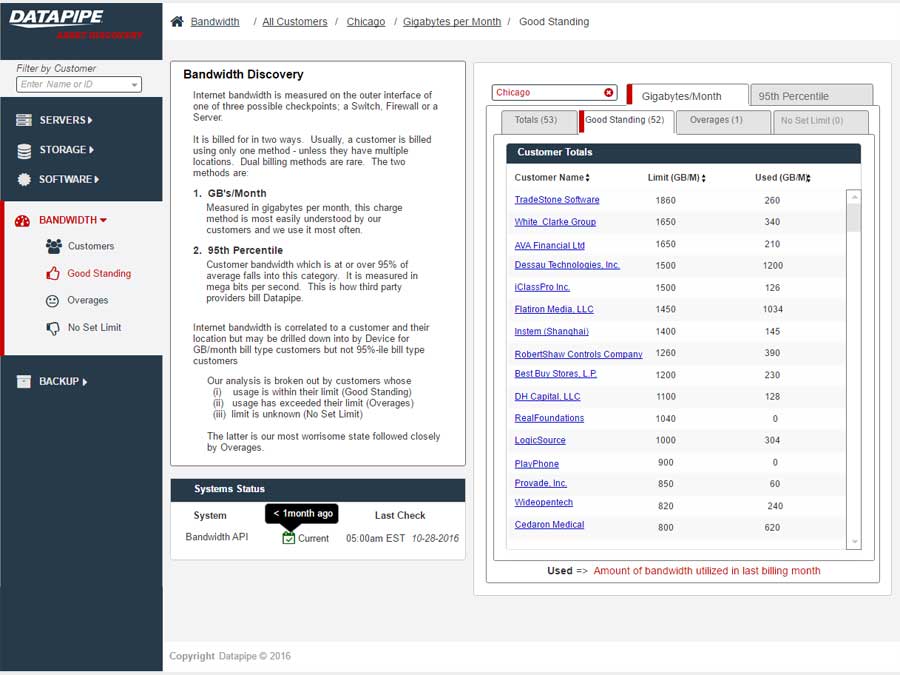
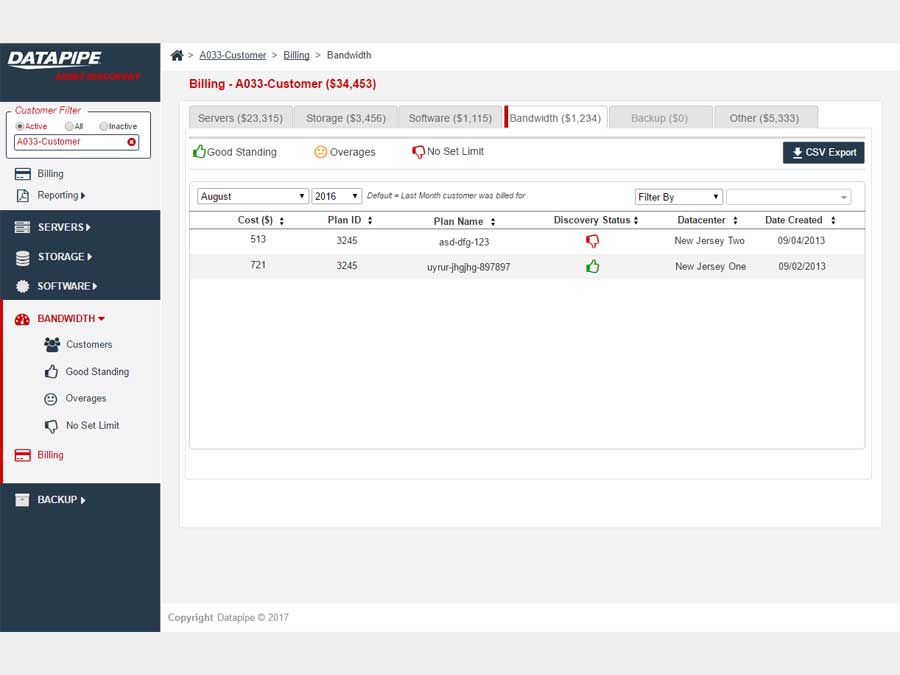
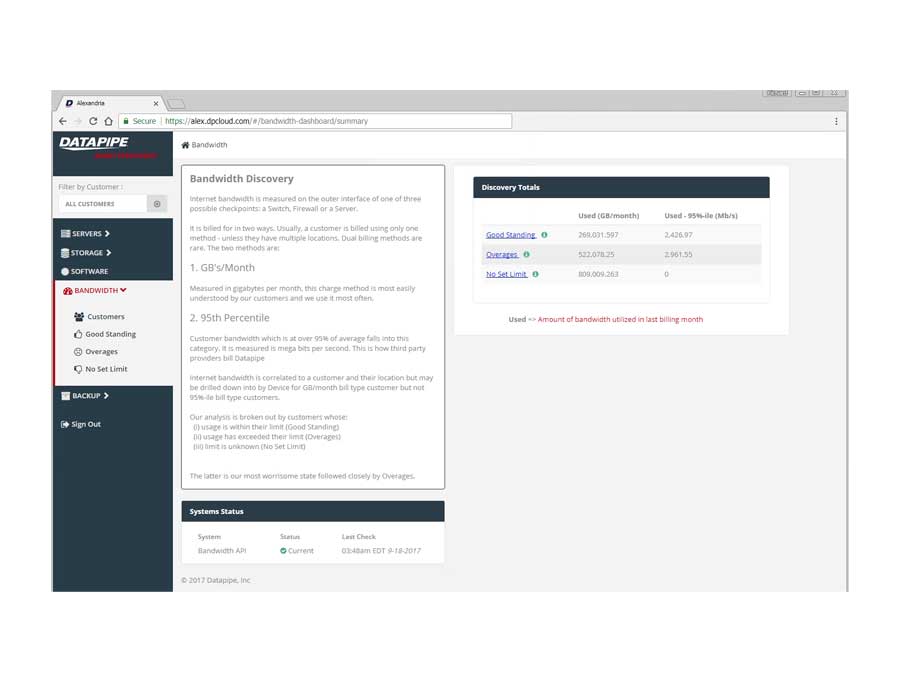
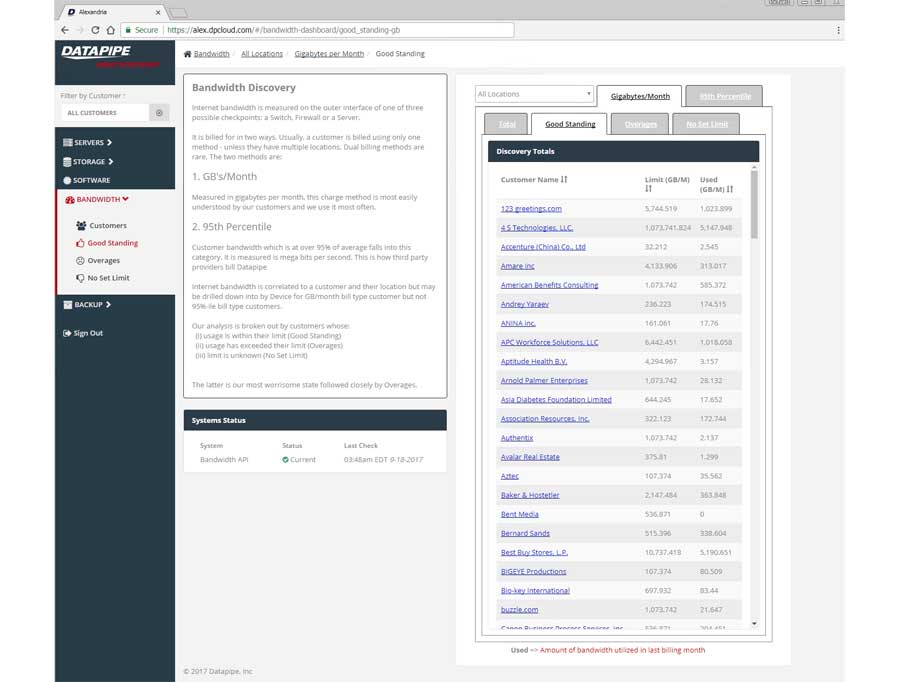
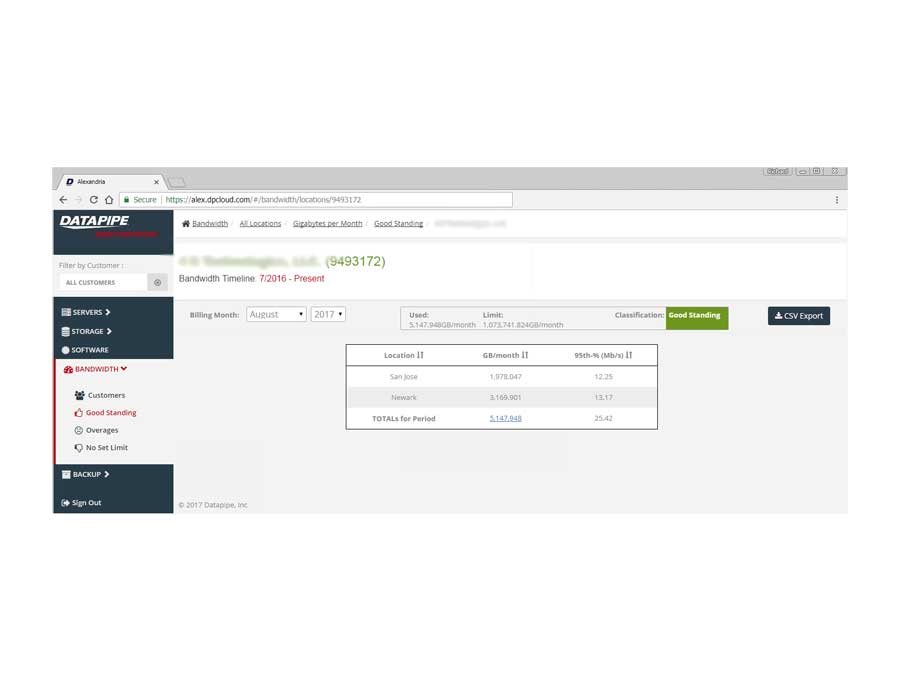
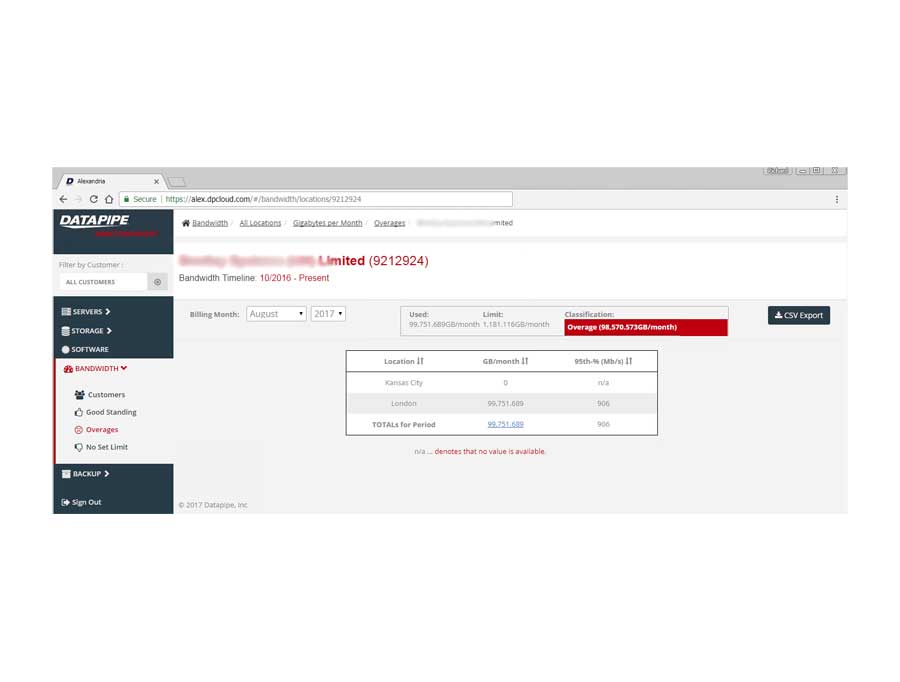
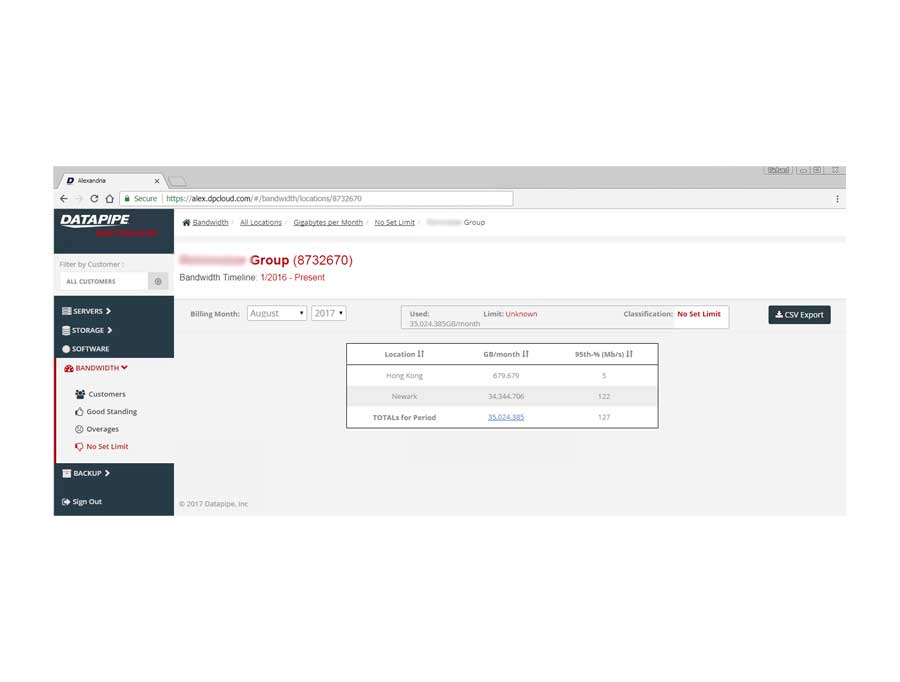
BANDWIDTH
Bandwidth exhibited its own special form of confusion because it was classified and billed for according to two quite different usage paradigms. Most customers are billed for the amount of gigabytes of storage their backups utilize per month but there is an esoteric and legacy billing model called the 95th percentile. From 5000 feet, it concerns itself with how one customers backups compare within a bell curve which speaks to 95% of all other customers usage.
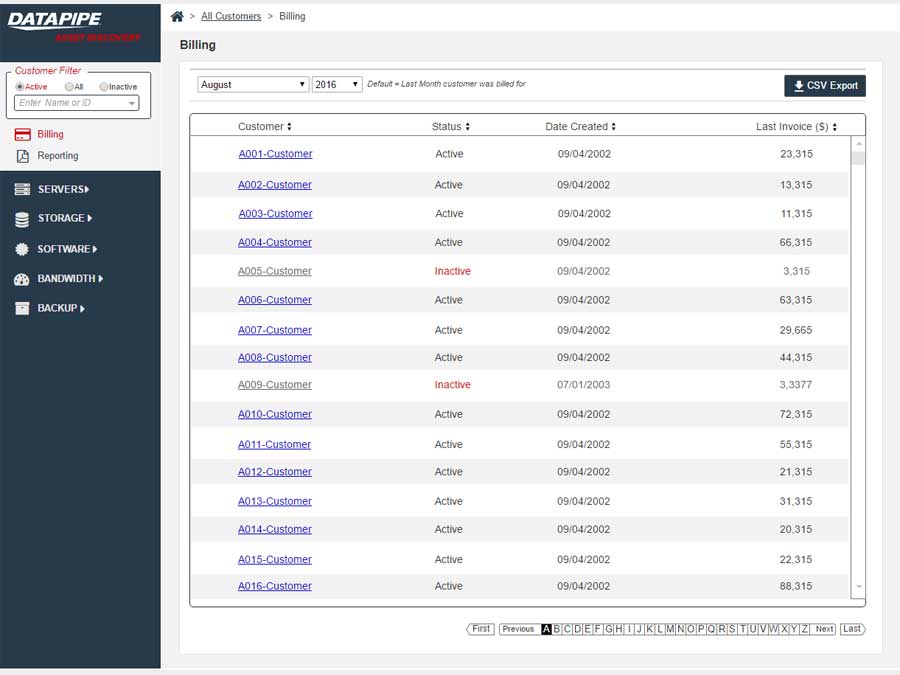
BILLING
Billing never got beyond the design concept phase as it involved some time consuming Financial API work which was adjudged to fall outside the scope of rev1.0. There was some debate at to whether this section should just be called 'Reporting' and billing would feature as merely one very significant data nugget. The following wireframes took a stab at how we might render it to inquiring minds for a rev2.0 release of the Datapipe Asset Discovery Tool
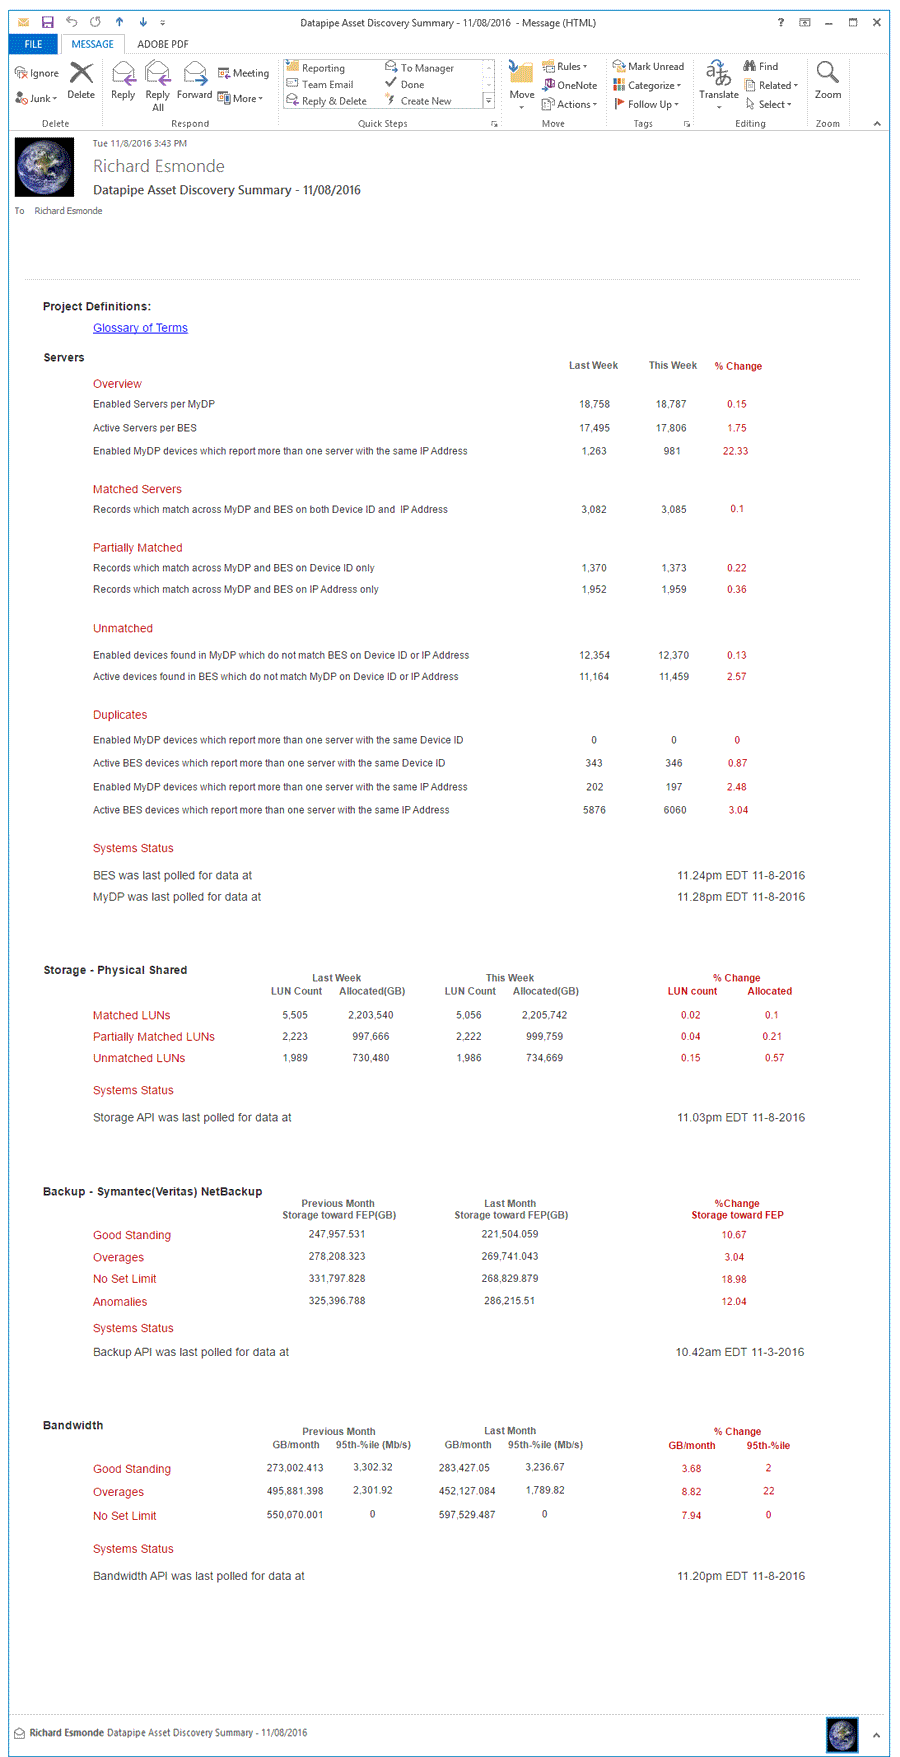
REPORTING
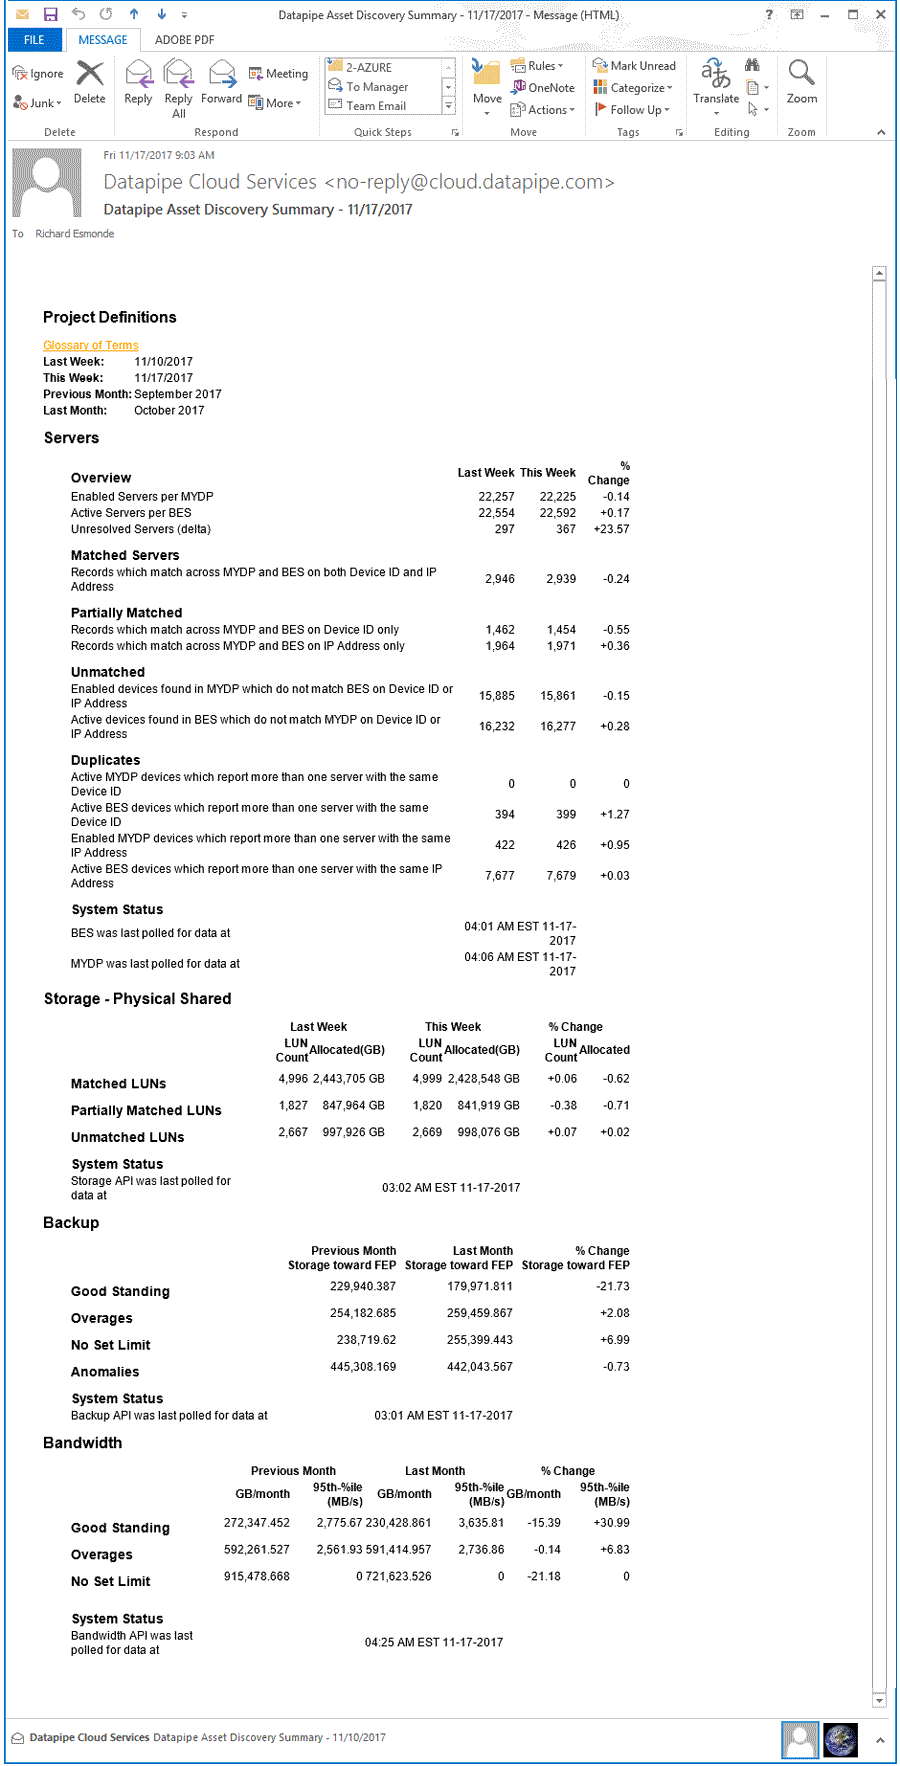
Until a reporting section was fully spec'd, stakeholders and executives wanted a weekly summary of all datapipe assets sent via email. Its chief purpose was to show progress or the lack of in terms of identitfying uncertainties/unknowns and resolving their staus to known, accounted for and 'attributable' to a customer. It should clearly convey the current status and compare it with the last report. Toward those ends, I mocked up such an email which our development team realized.
The Production Application
After much Angular 1 and 2, CSS, jQuery and Ruby wrangling, the development and QA team finally got rev1.0 out the door.


Lessons Learned
I think the project could have focused more on how well the UI was suited to a tablet. Our template was responsive but we ran out of time to test it on smaller media. The shear volume of data returned meant that smartphones were not a necessary consideration as the user base was always viewing the data in an office on a Mac or PC. However, as the product matured, it's reasonable to assume it might be rolled out to a broader audience so, tablet support should be tested more vigorously as a stringent requirement. Next steps might be to make the UI's aesthetics a little more in keeping with the protoframes - there's too large a visual delta there right now but Datapipe was acquired by Rackspace so, the project's future is uncertain.
Conclusion
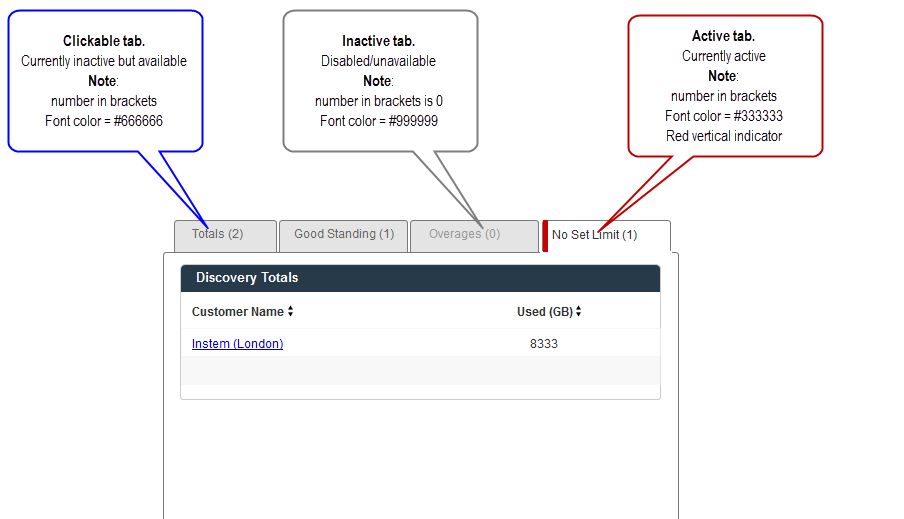
So, billing and software were cast into a future roadmap (rev2.0). Looking back, it was quite a scramble as each API returned data in different ways but it never got away from us thanks to a highly collaborative, agile team effort. The UI could use some refinement in terms of visual queues and aesthetic standardization. Some of this started but had still to be implemented. For example denoting tab behavior.
There's no doubt we emerged with an MVP product that can use some polishing and some features which never got beyond my 'protoframing' conceptual phases - but from humble beginnings come great things and if Rackspace need to delve into Datapipe customer assets they have plenty to get started with from what we built.